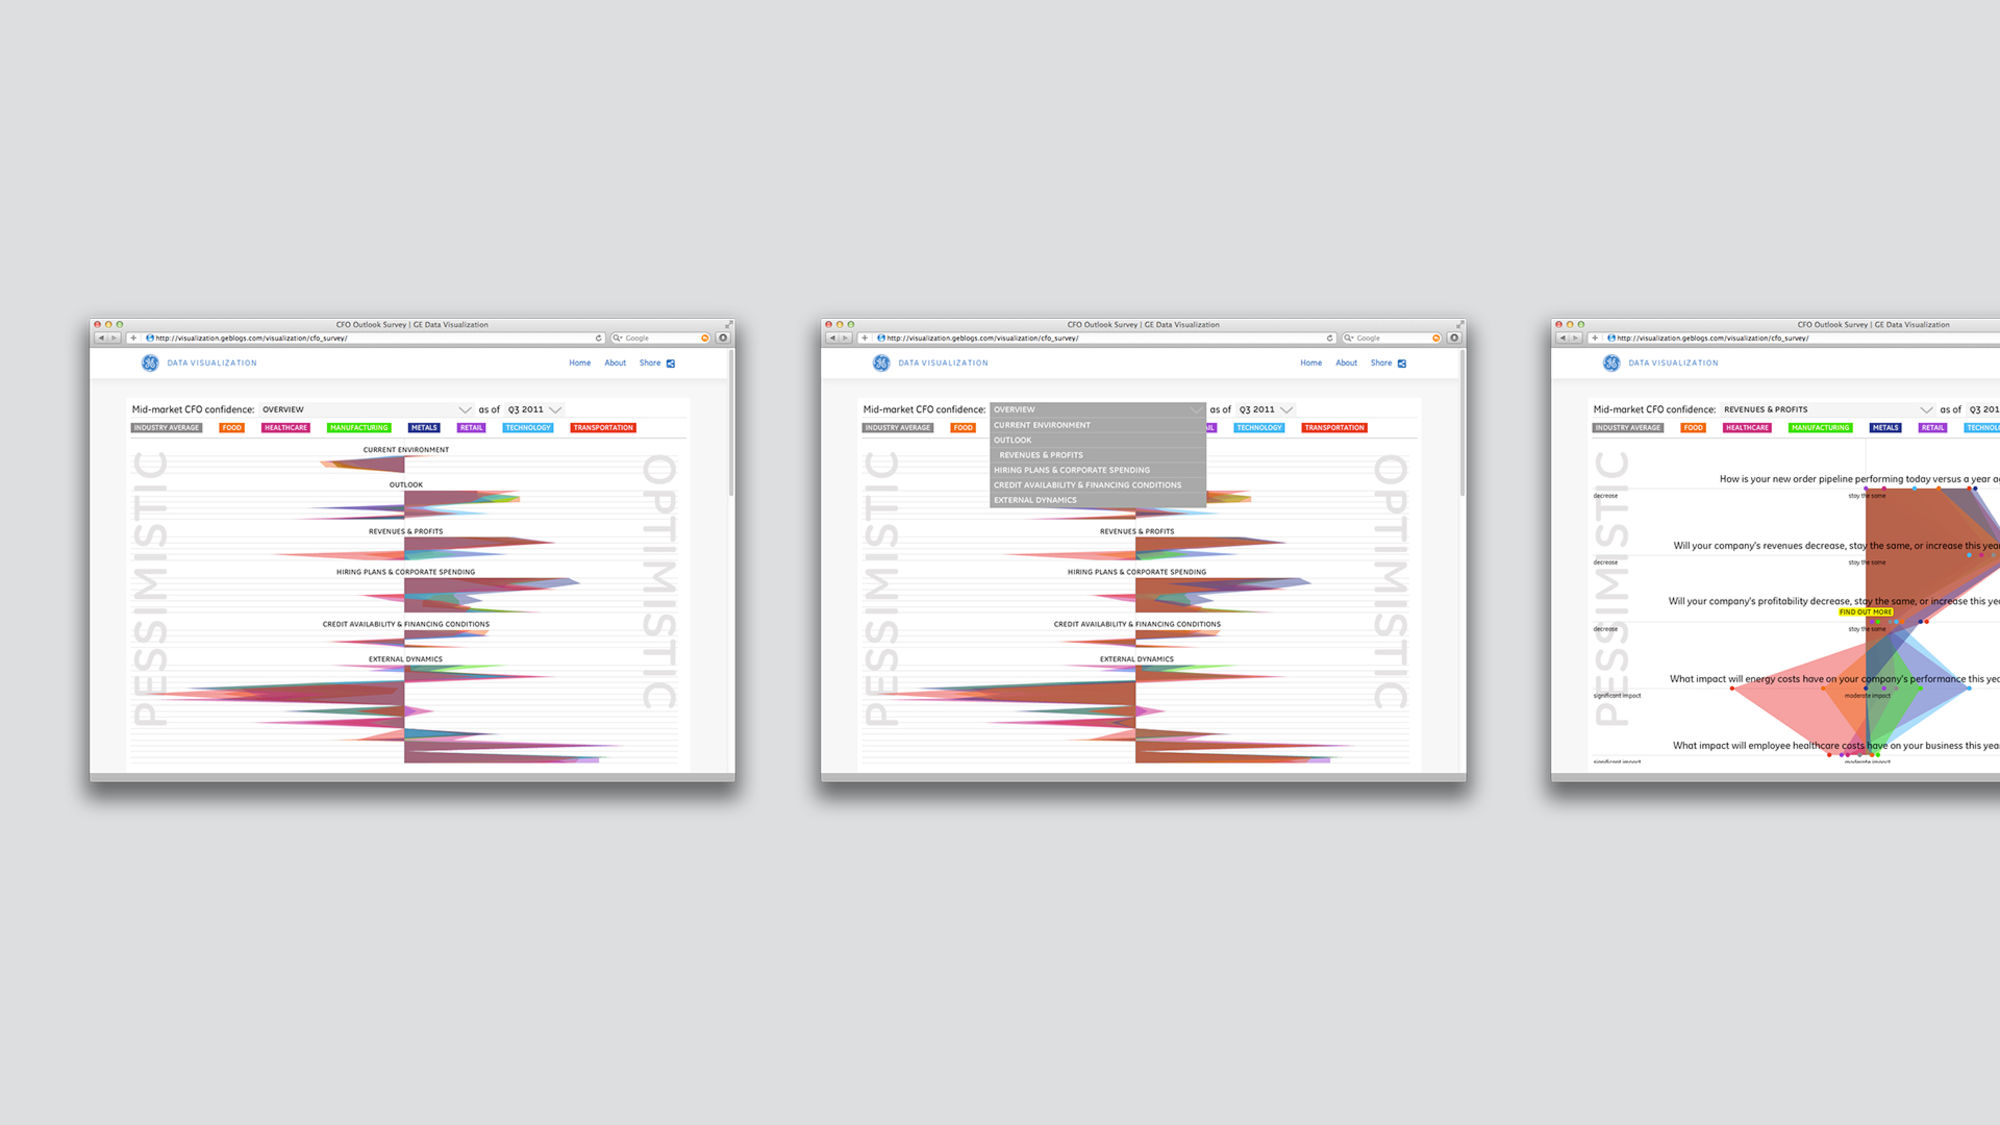
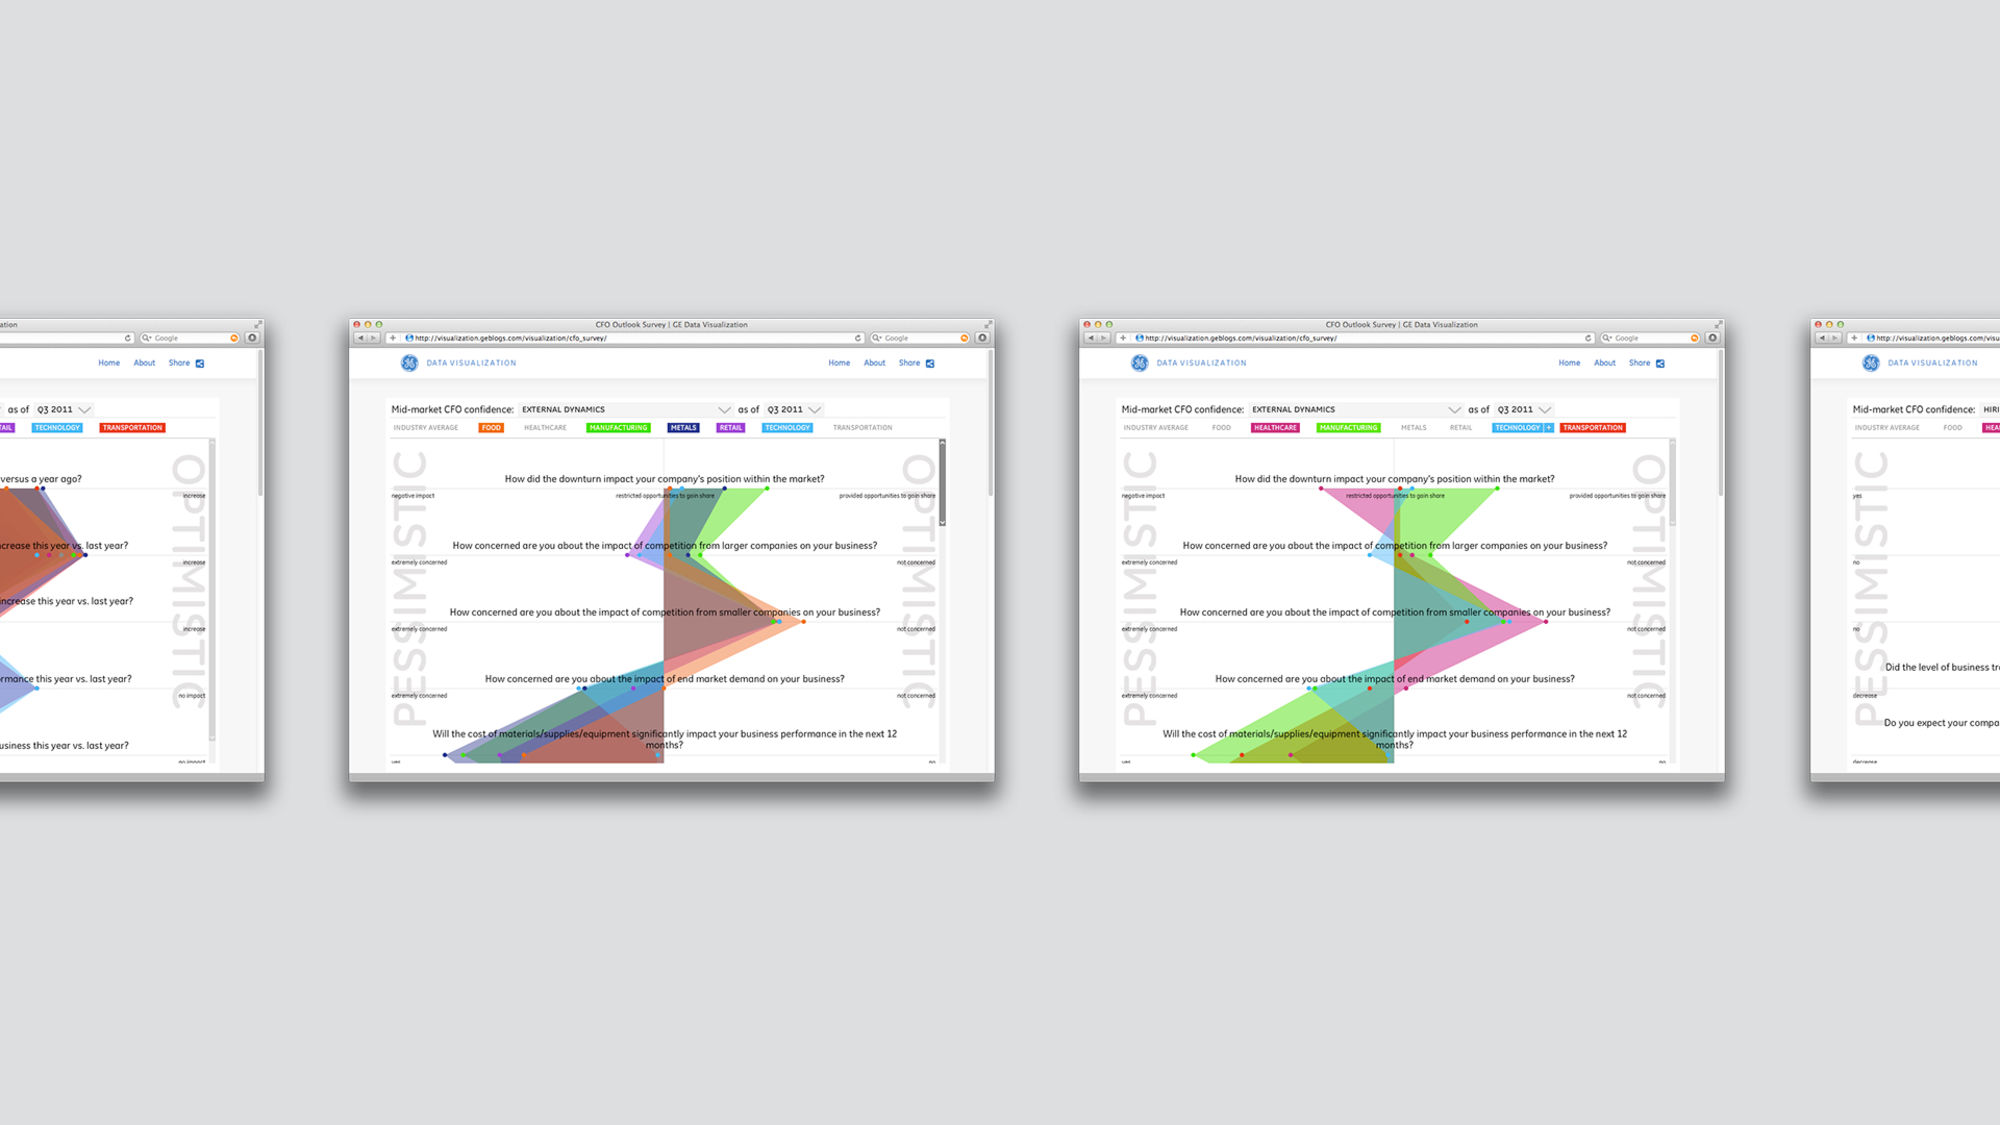
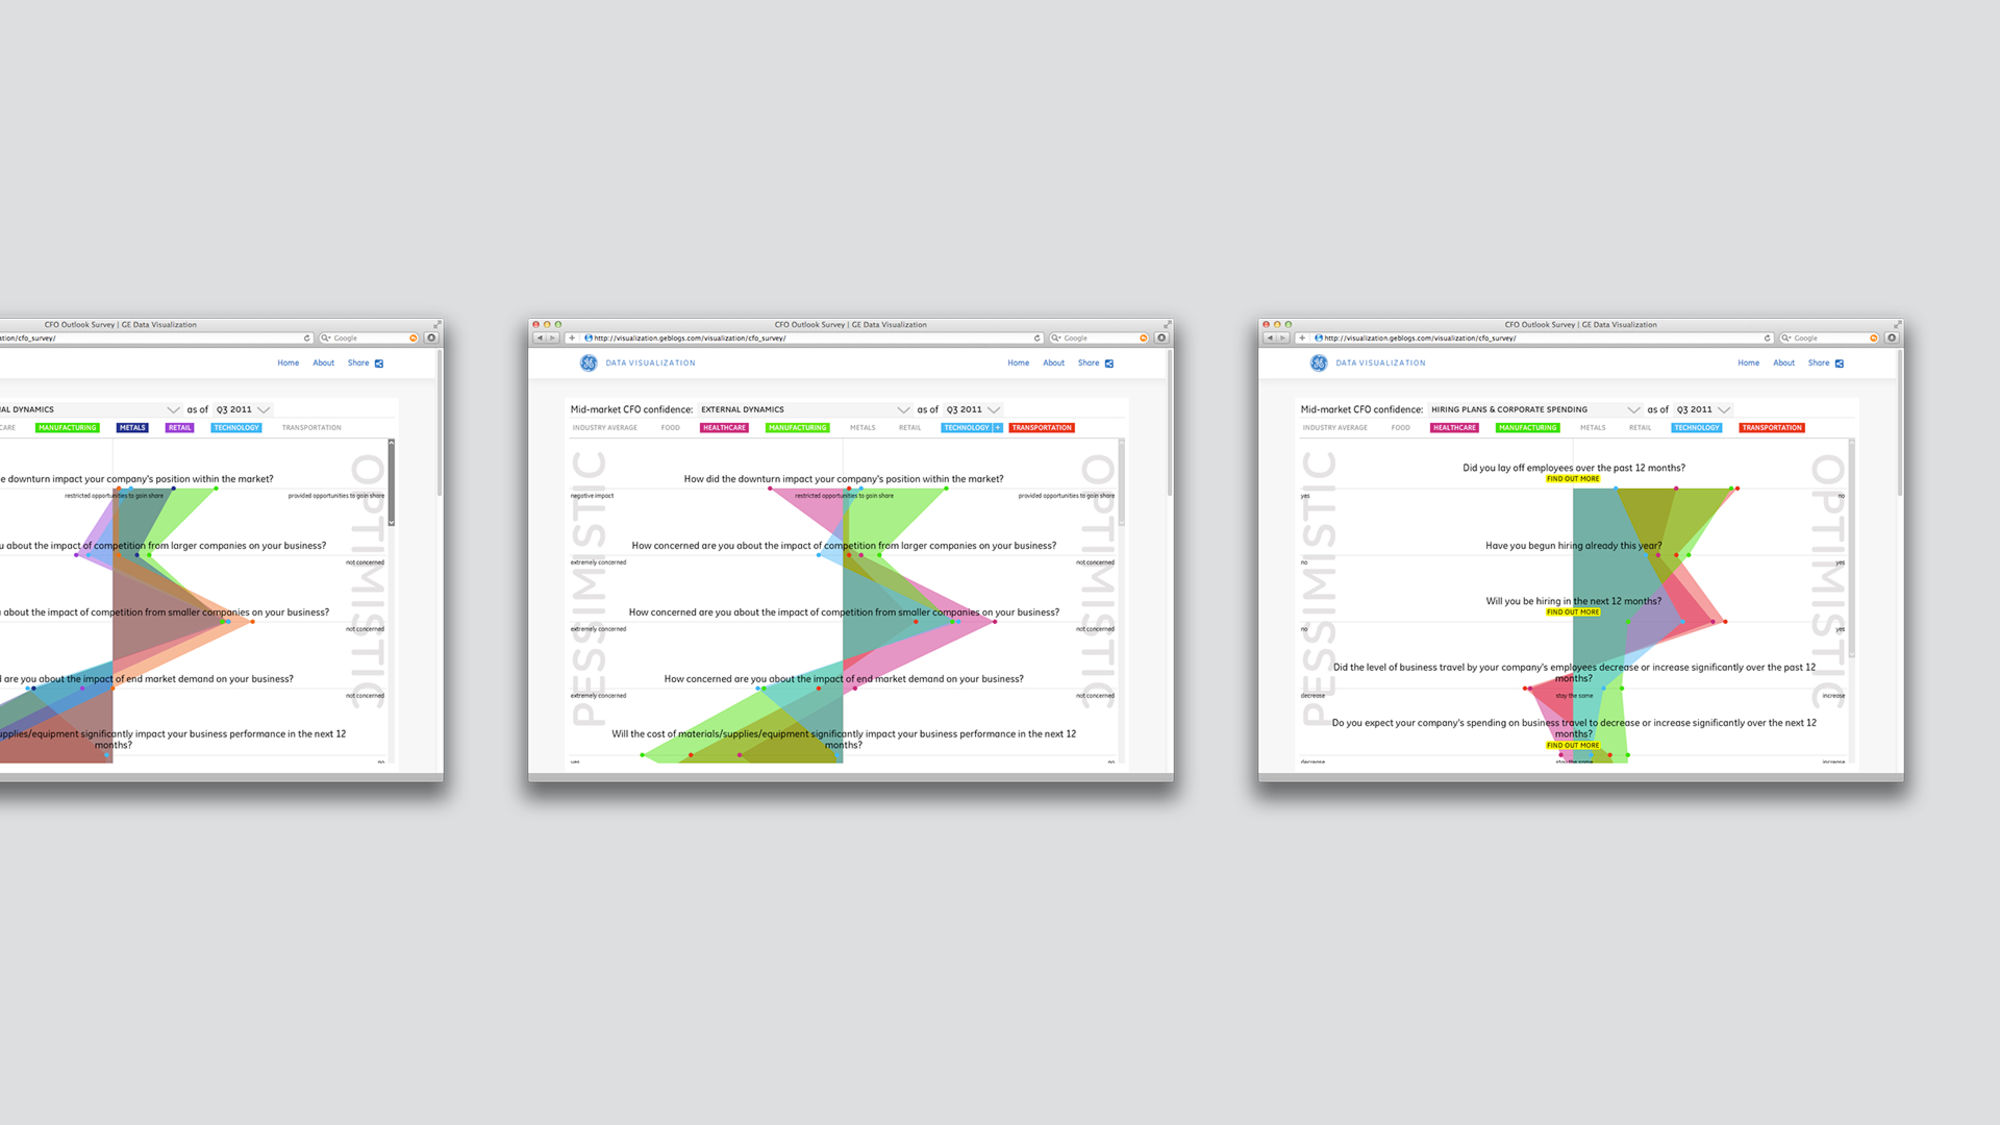
This interactive data visualization, developed for GE Capital, Americas, shows the results of a survey of more than 500 CFOs, asking how confident they are in the present economic recovery. The survey was updated quarterly over one year.
We developed a way of "normalizing" the questions so that we could represent the answers on a linear scale from minus 5 ("pessimistic") to positive 5 ("optimistic"). This allows the viewer to see an at a glance single view of the survey results. From this big picture, the viewer can select the economic topics of interest and drill down. Industry categories are color coded and the layering of data allows for easy comparisons.