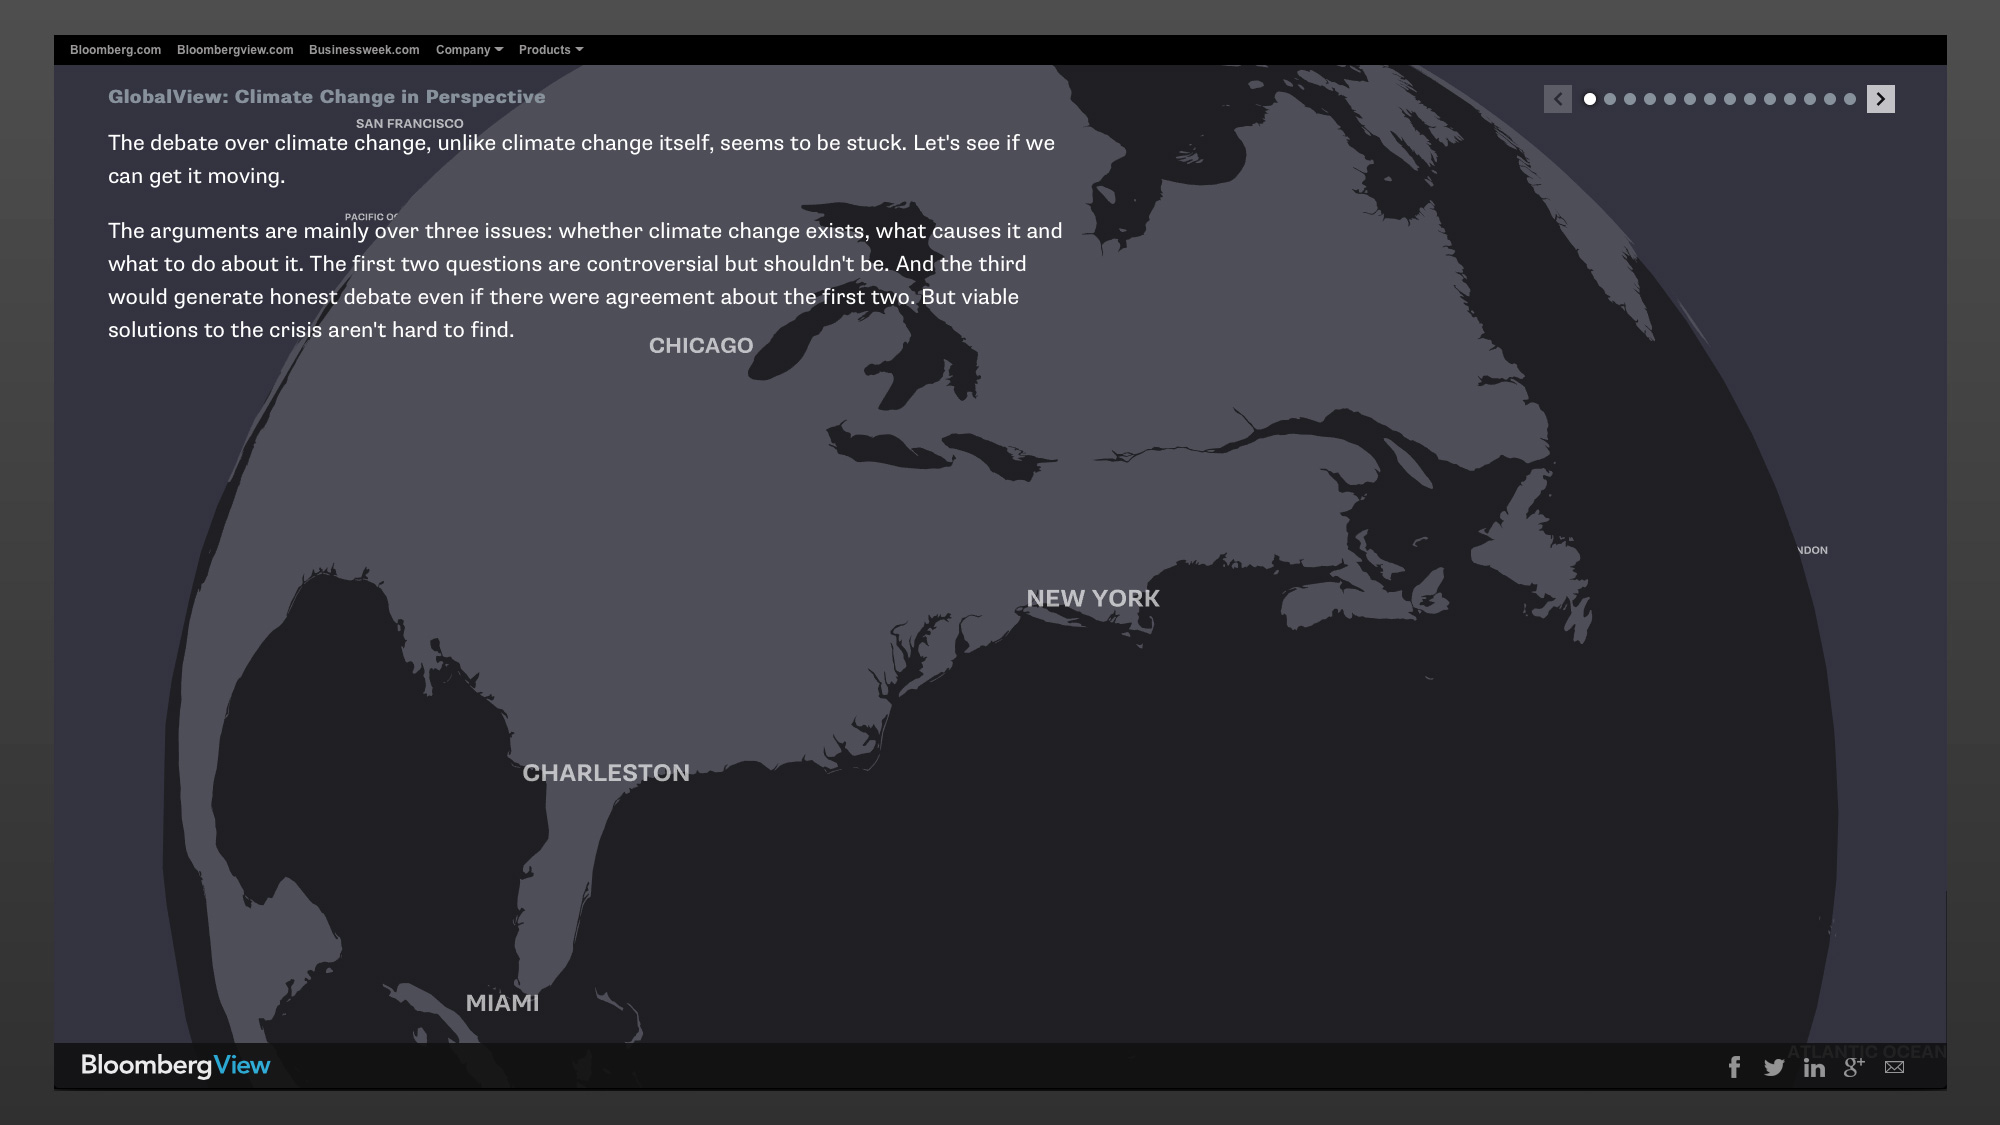
Typically, charts and graphs are embedded in stories to “illustrate” the narrative. At Bloomberg View, the opinion section of Bloomberg News, we reversed that relationship by embedding the narrative inside an immersive full-screen data environment. Two templates were created for recurring story “types”. The first is an immersive time-series template (called “dataview”) and the second is an immersive 3D dynamic globe visualization (called “globalview”).
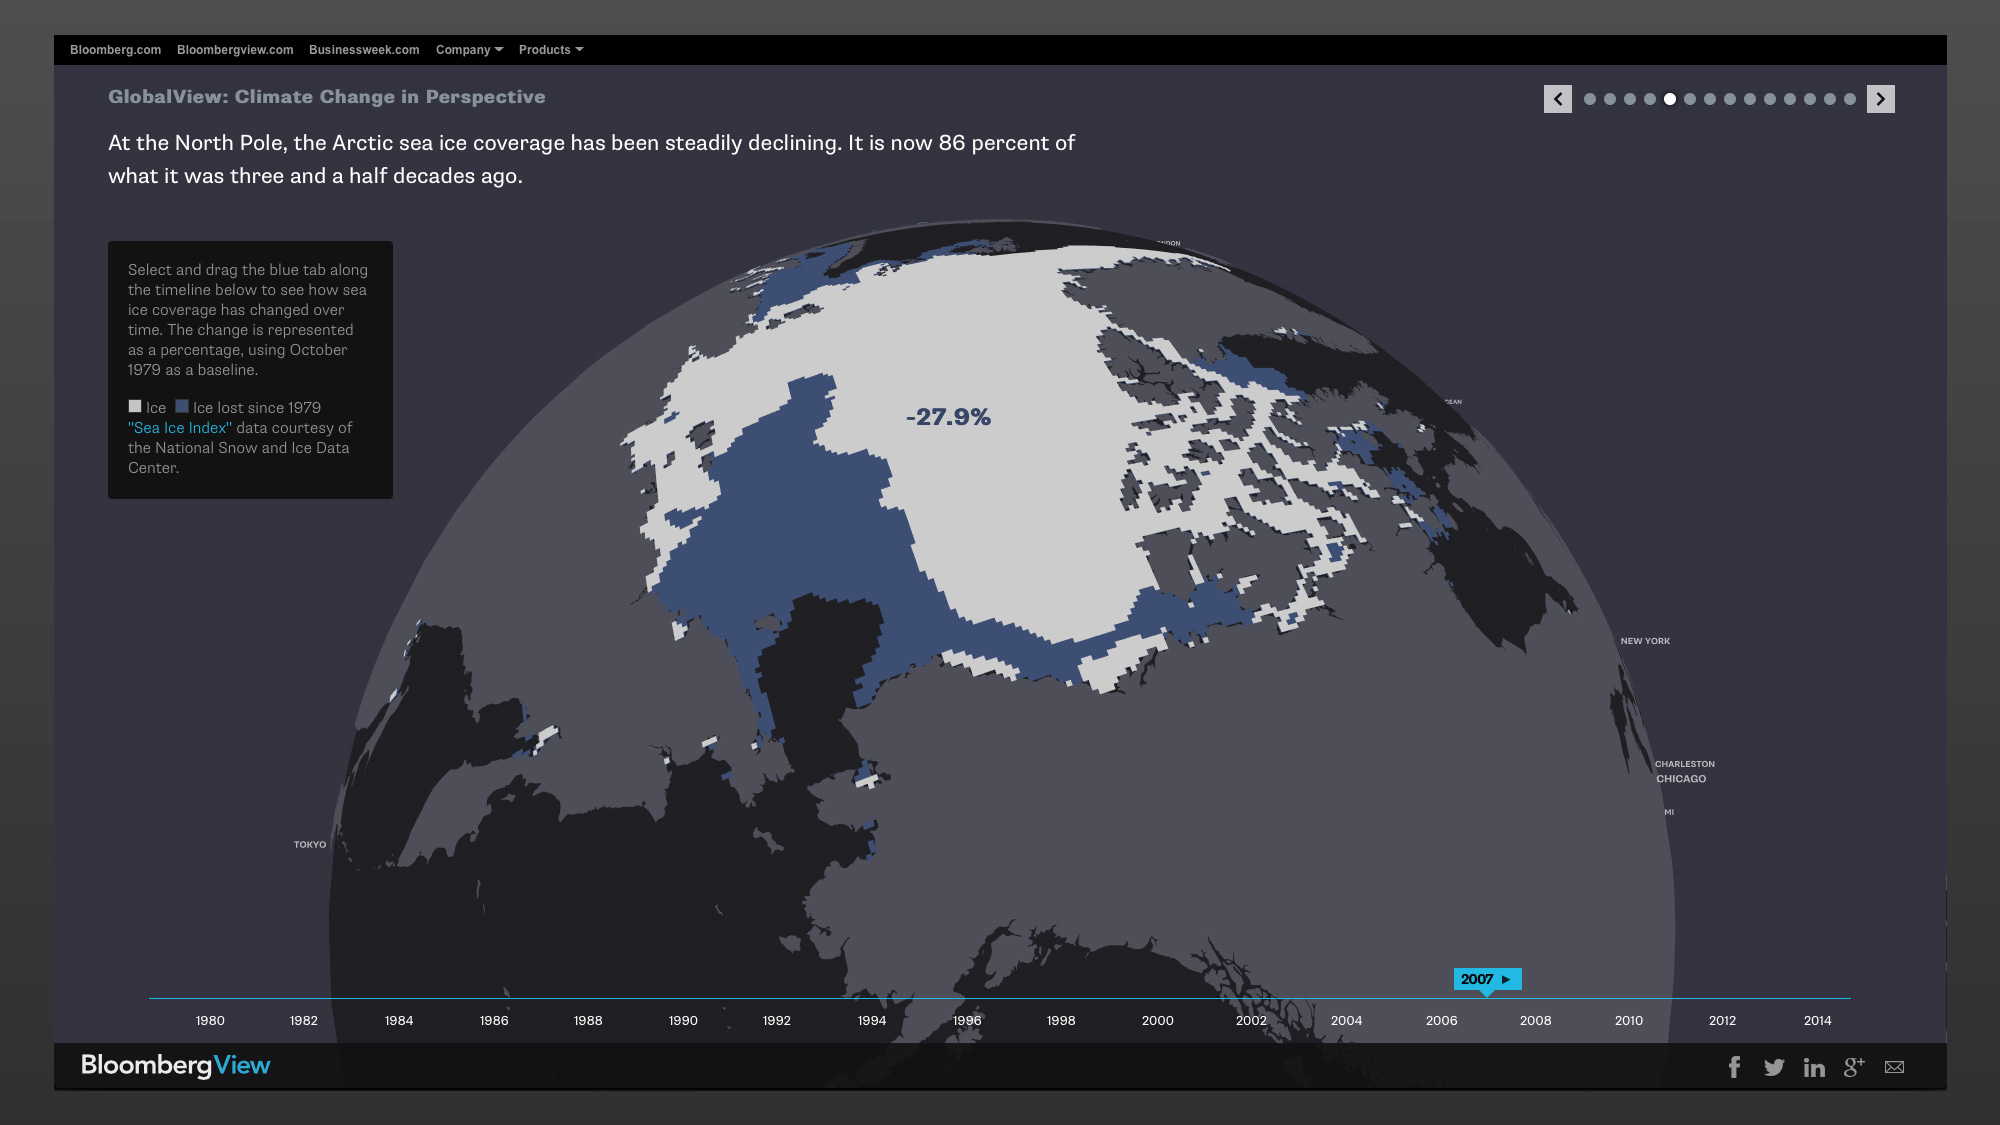
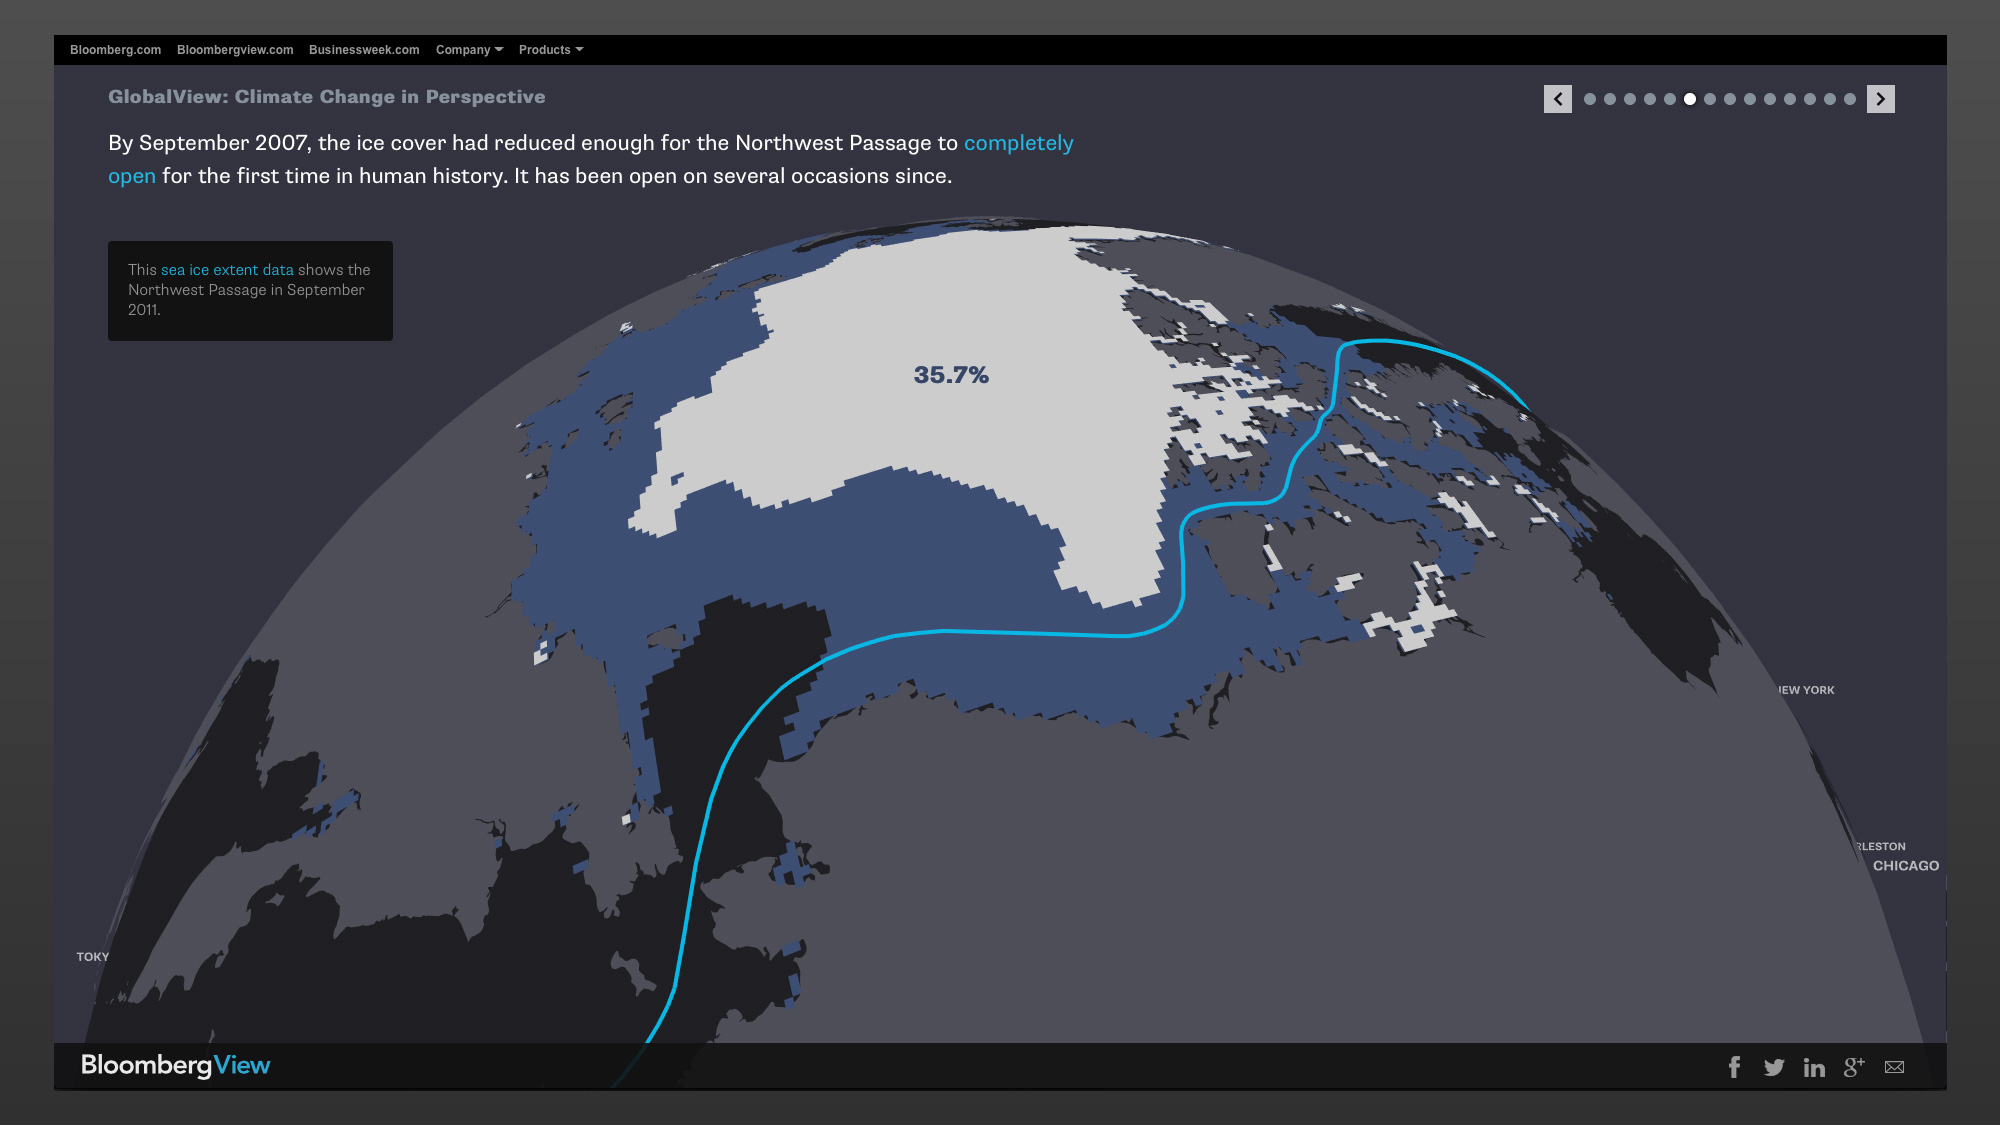
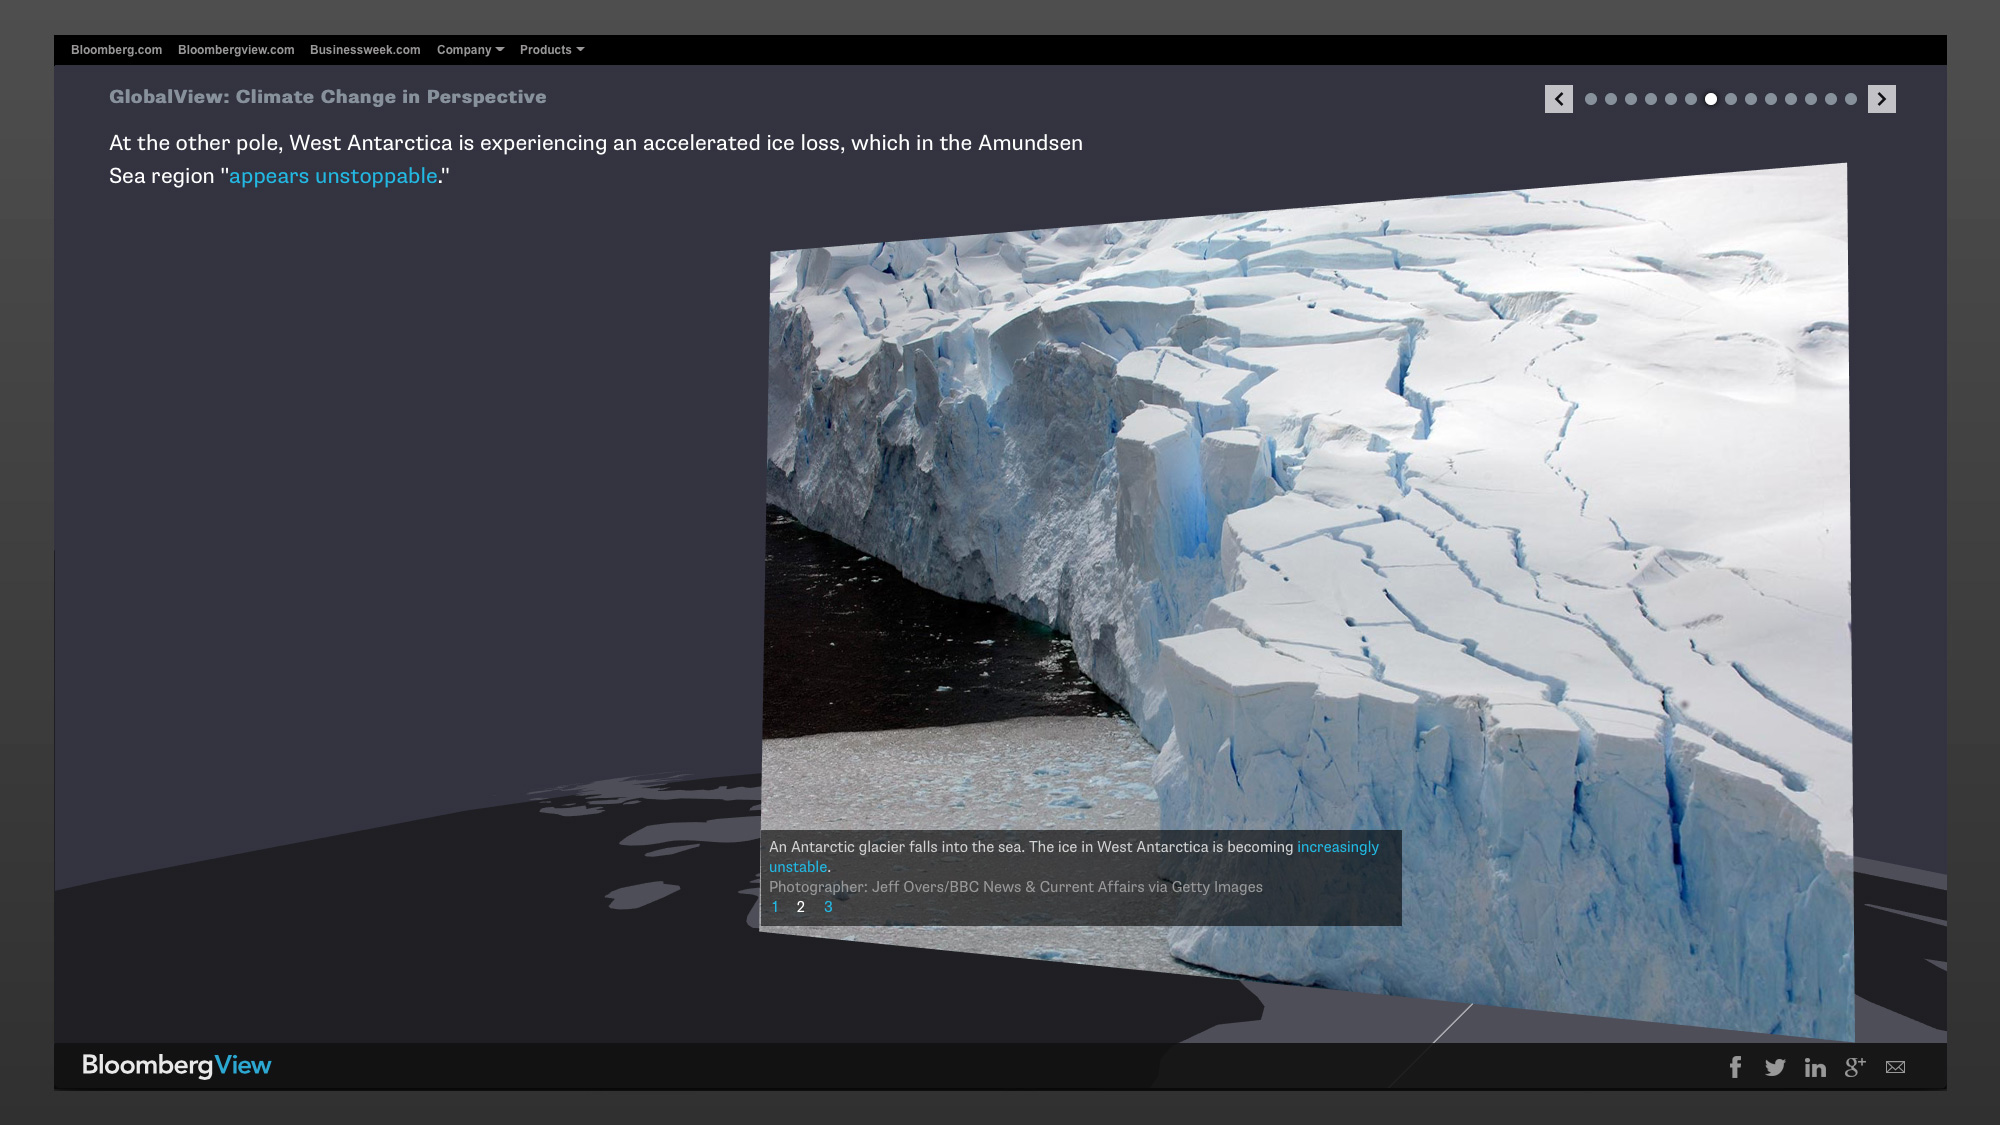
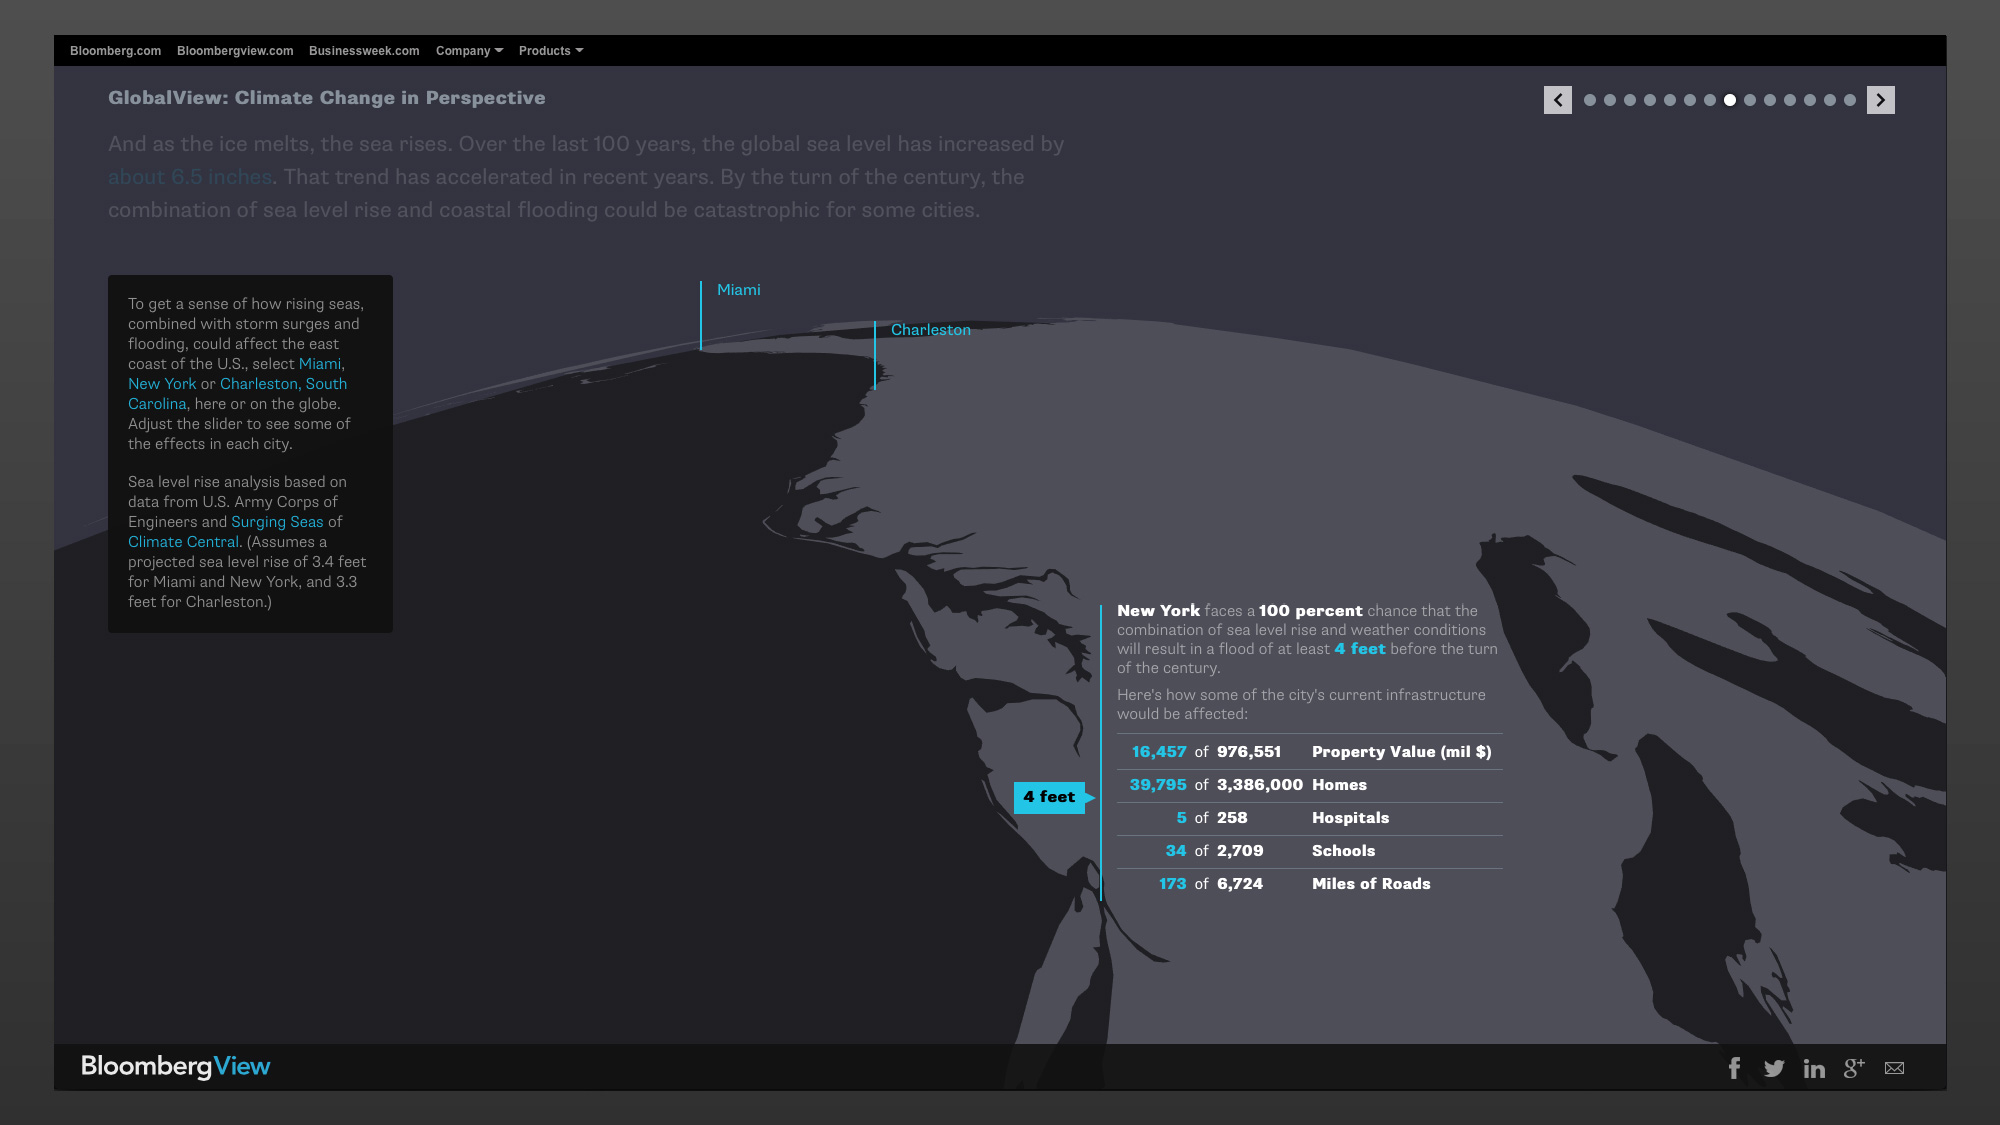
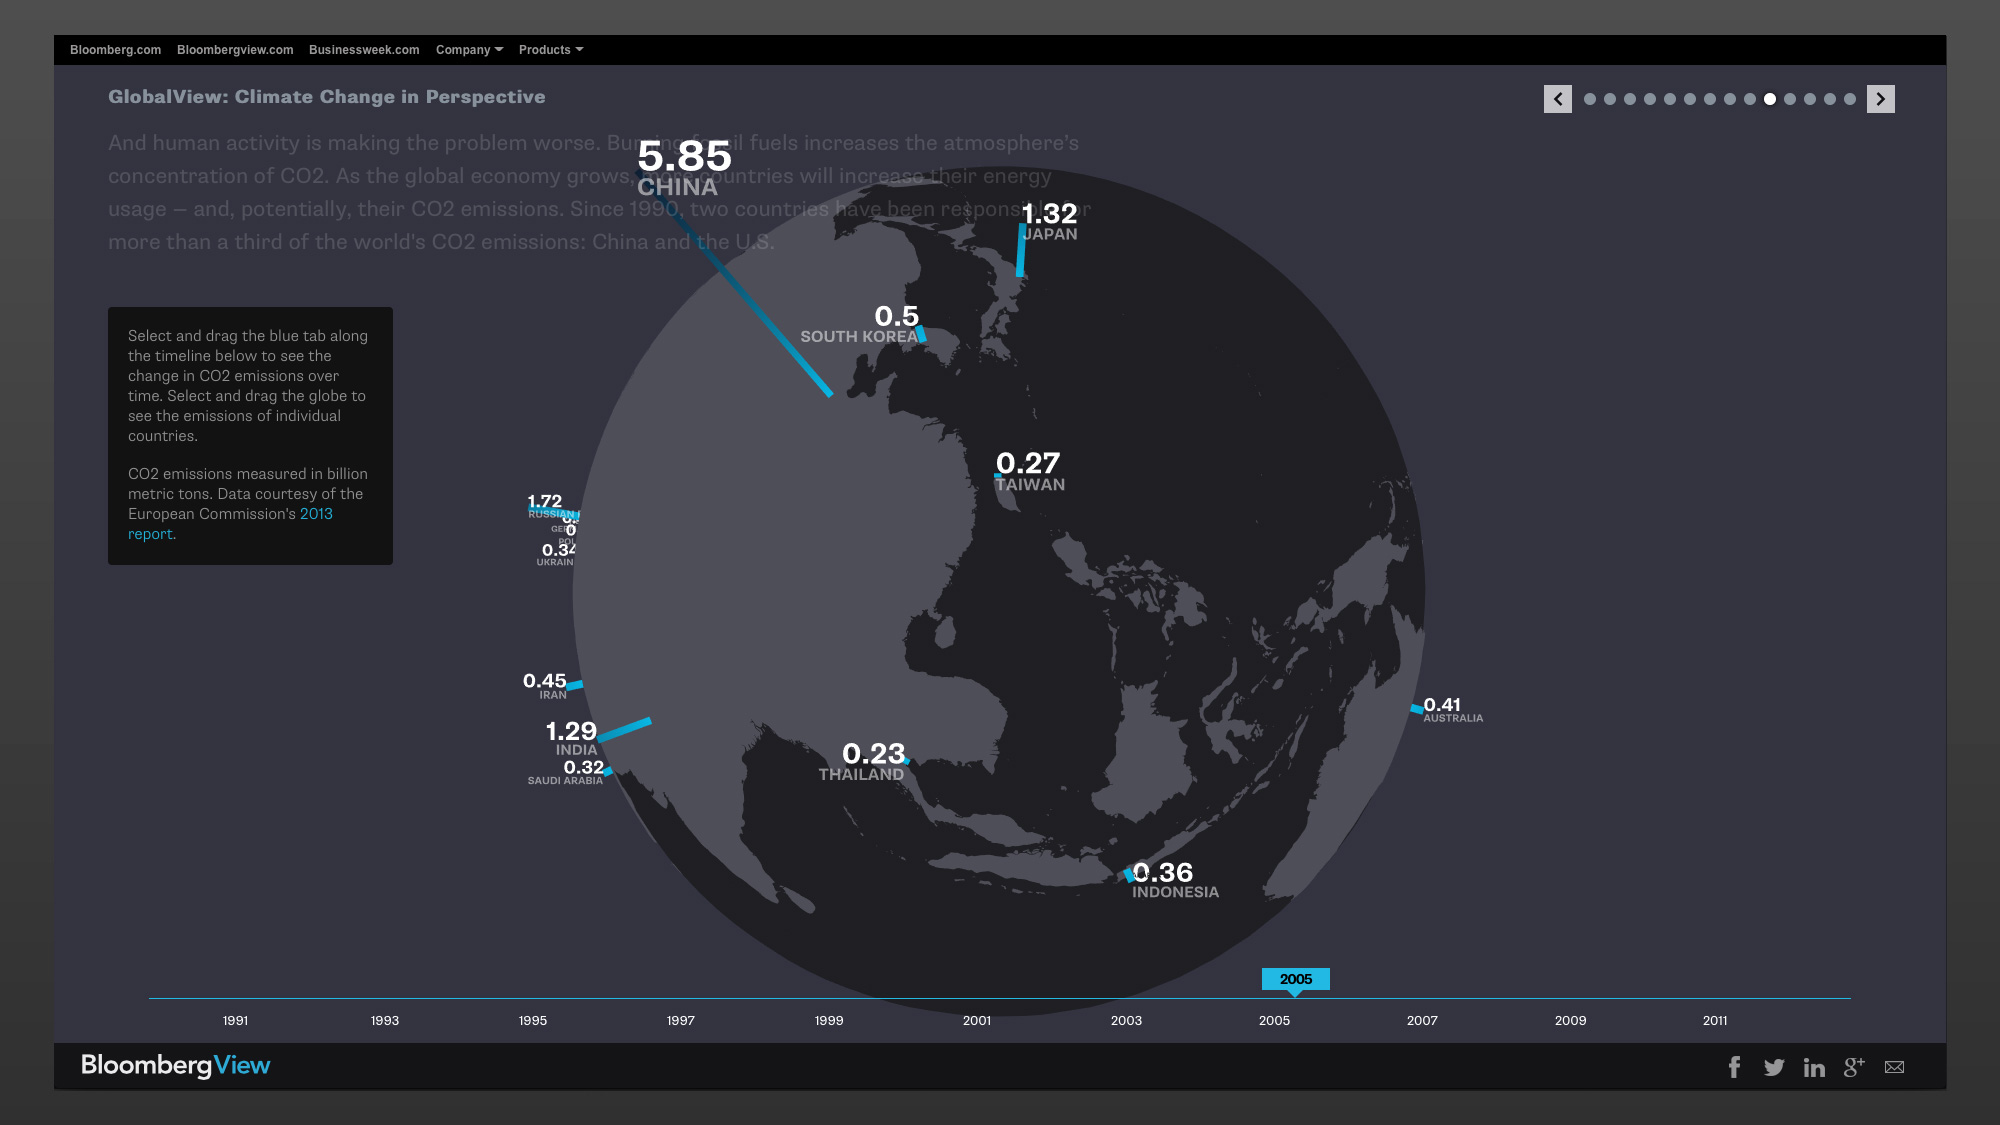
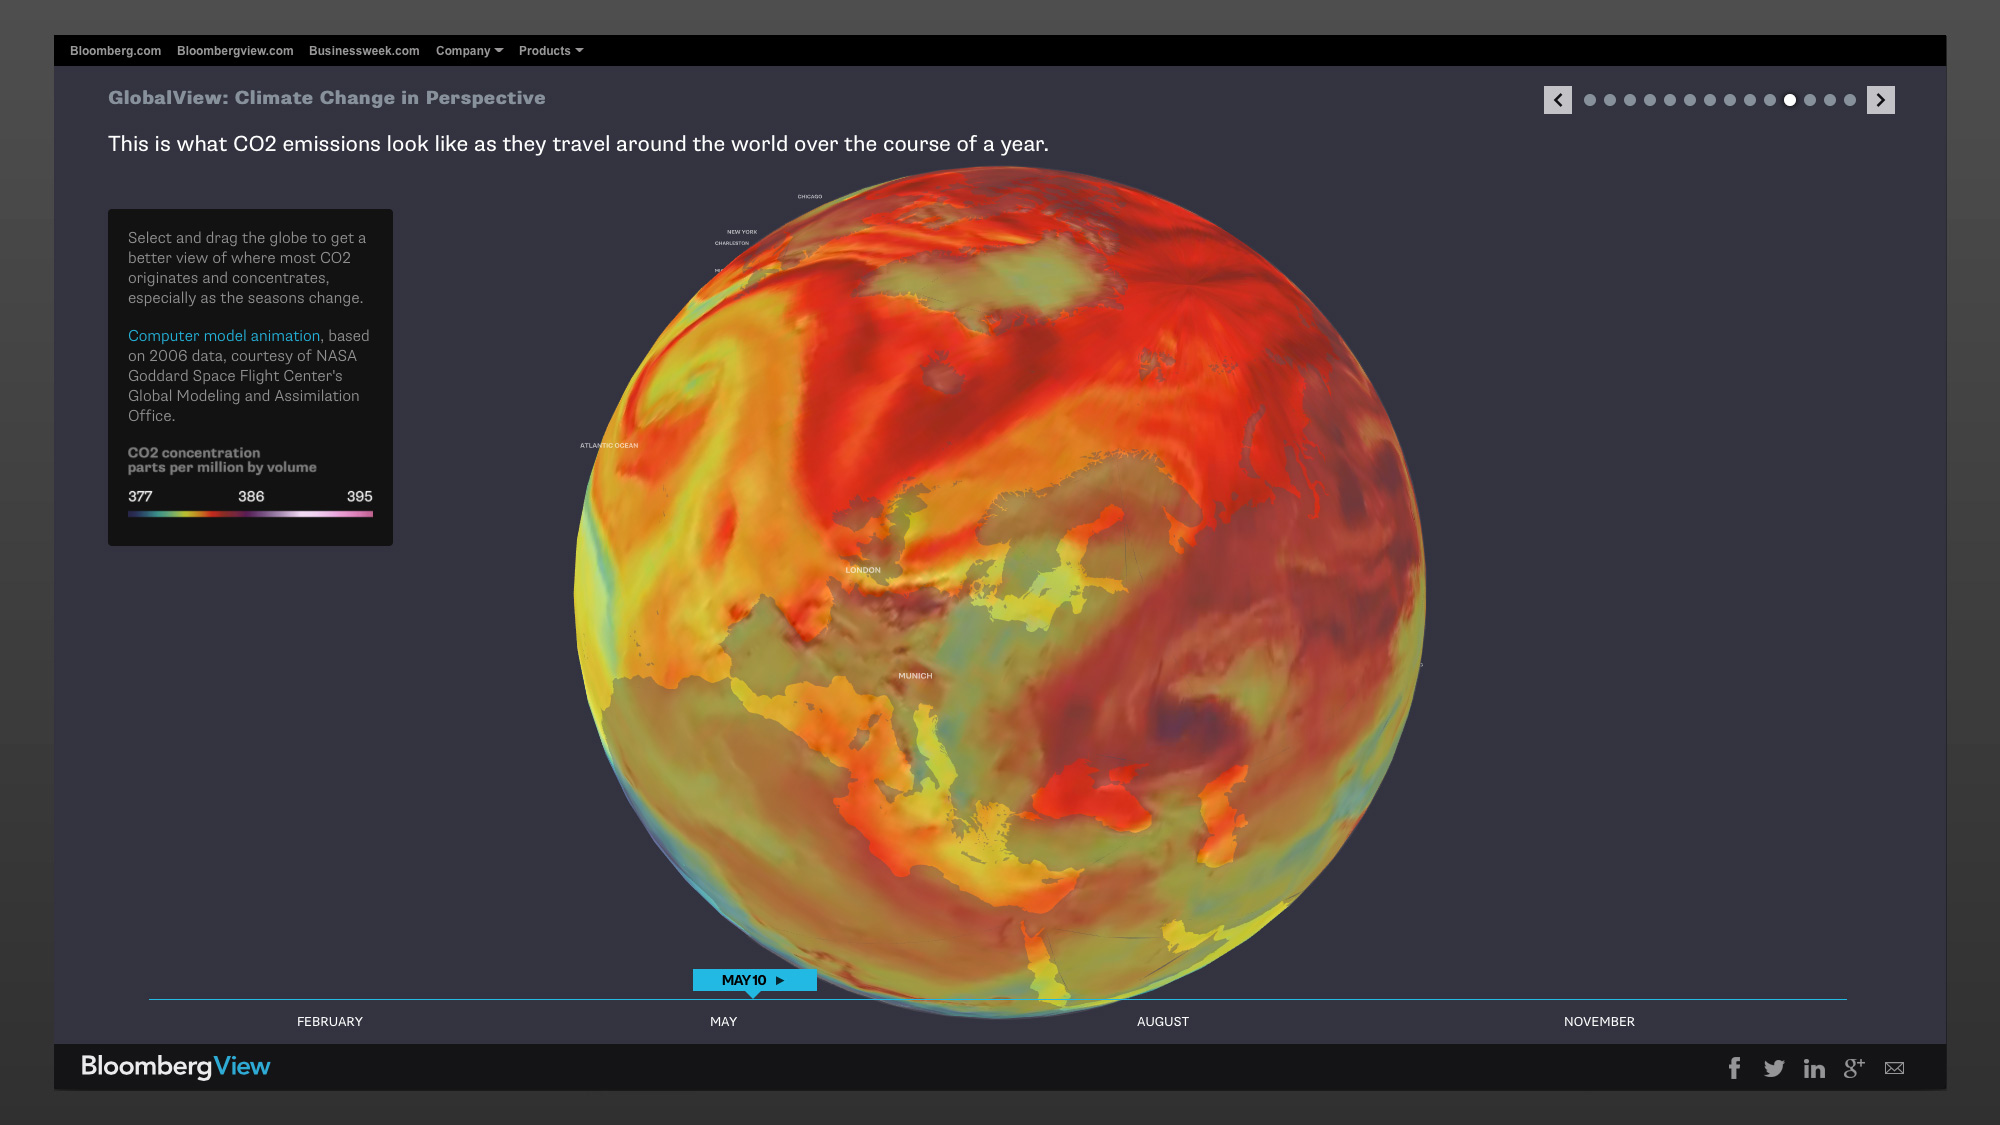
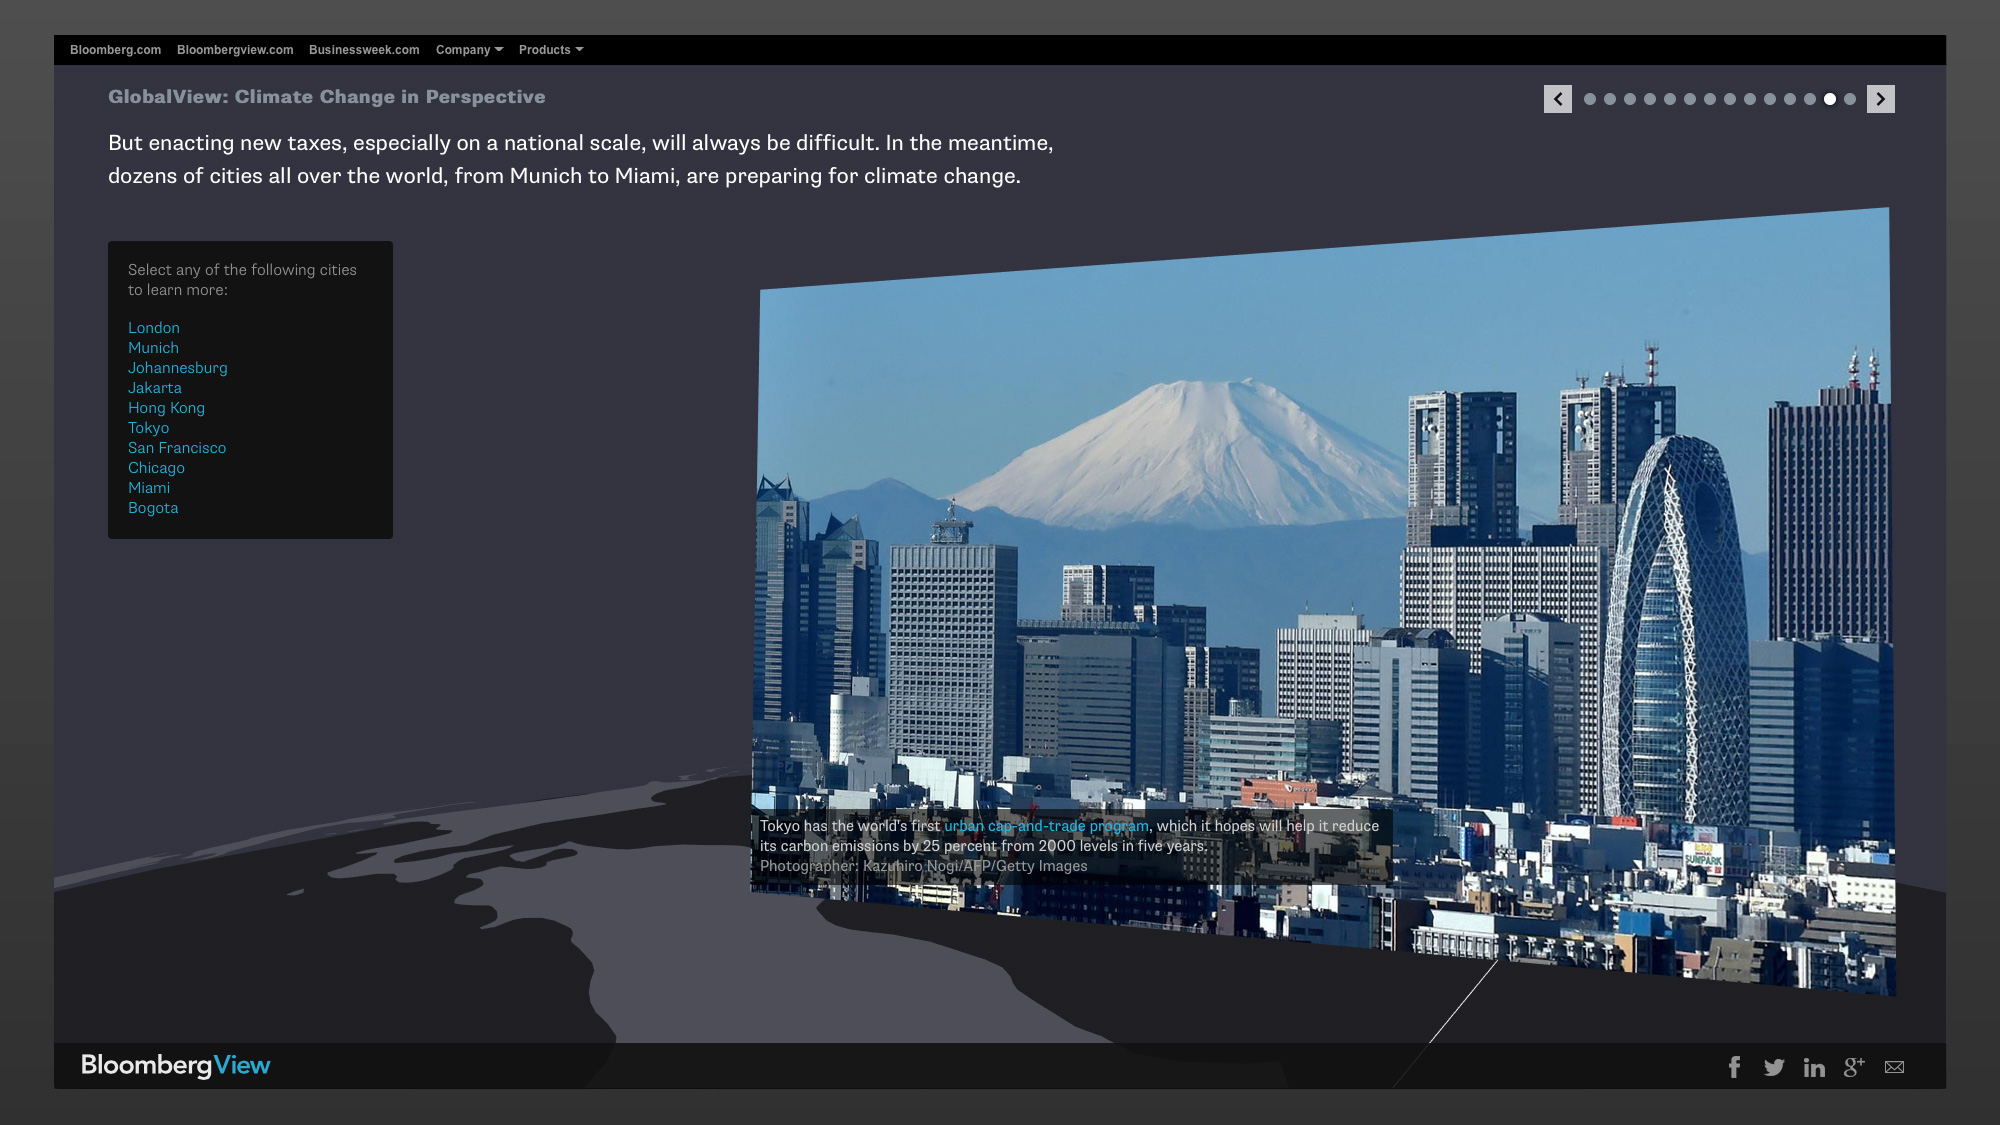
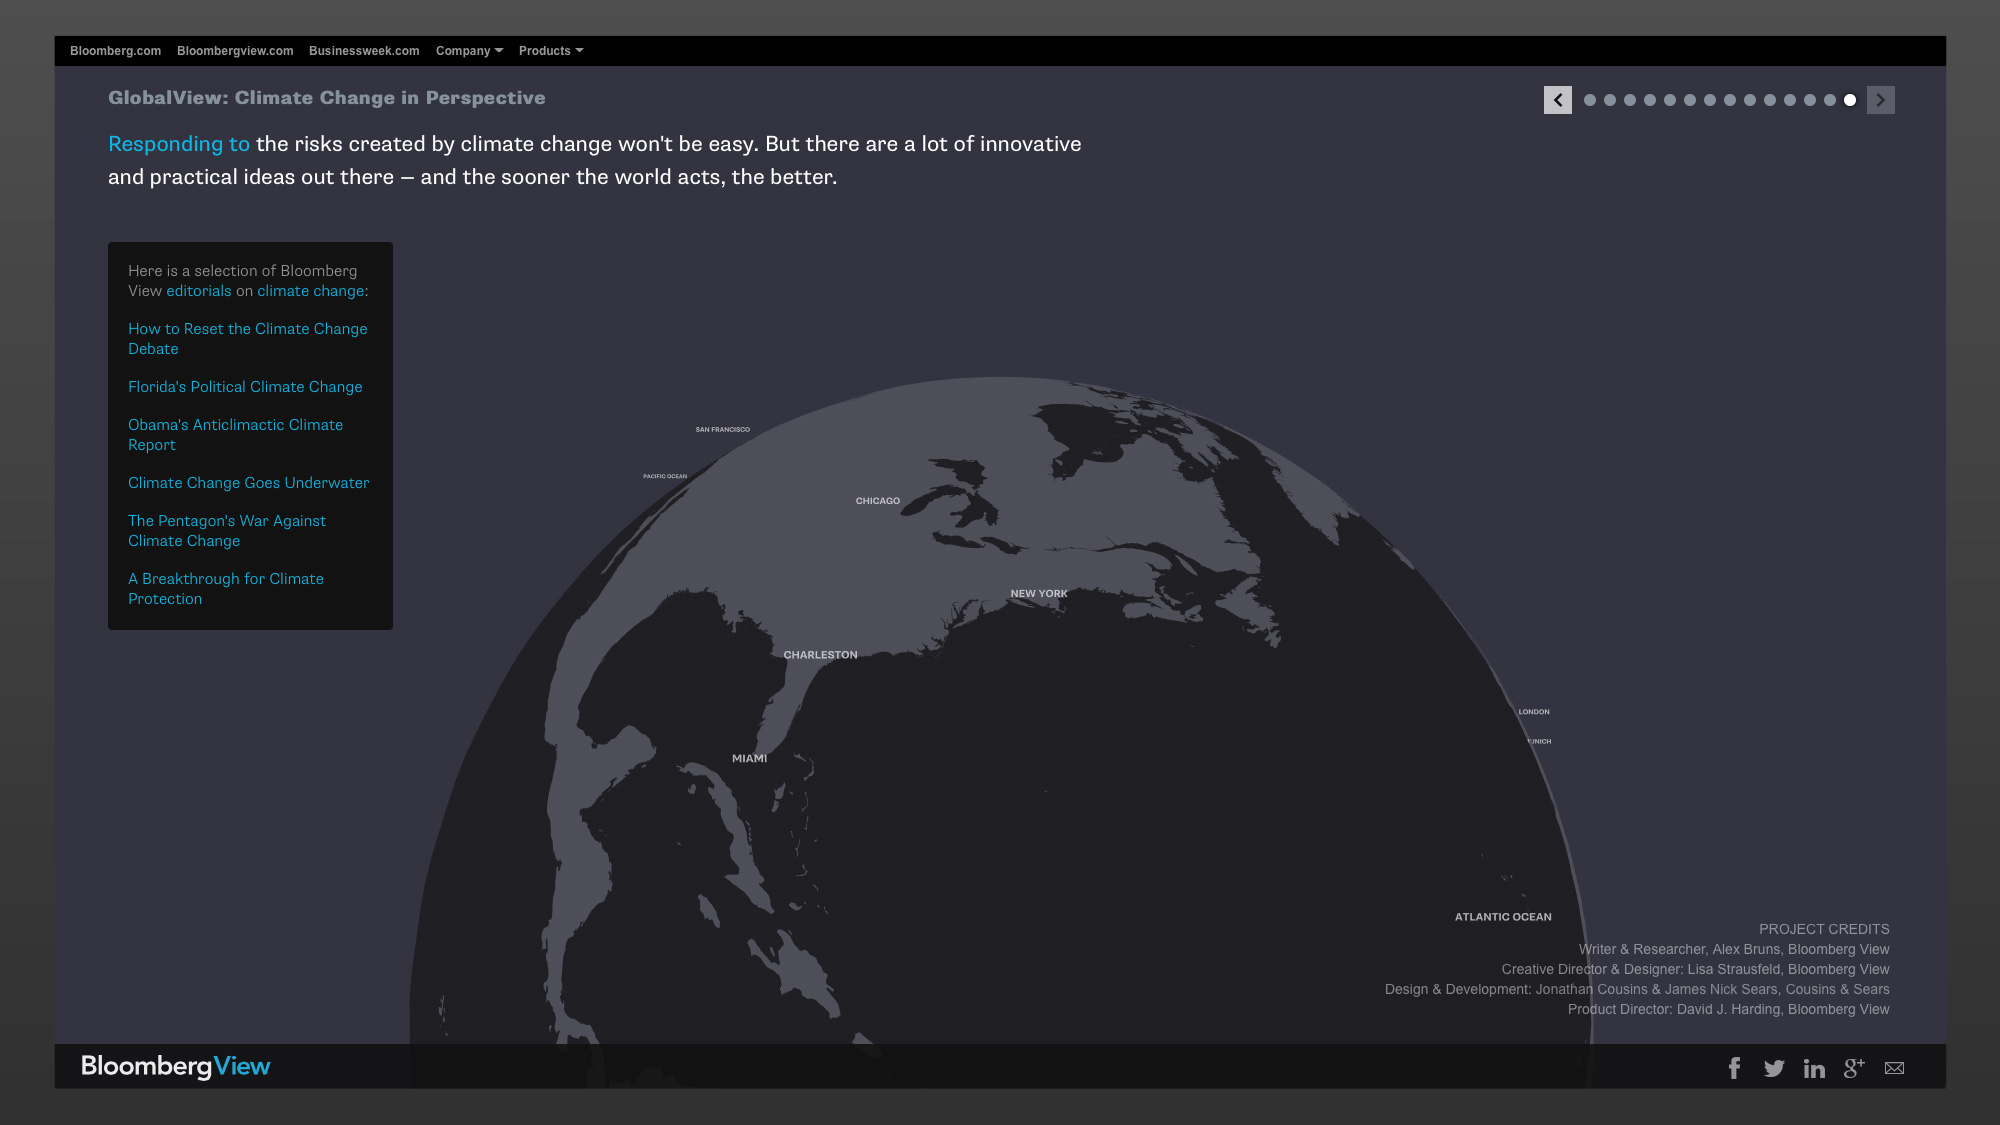
This first application of the "globalview" template tells the story of climate change around the globe with narrative, images and data. Experience it for yourself on BloombergView.