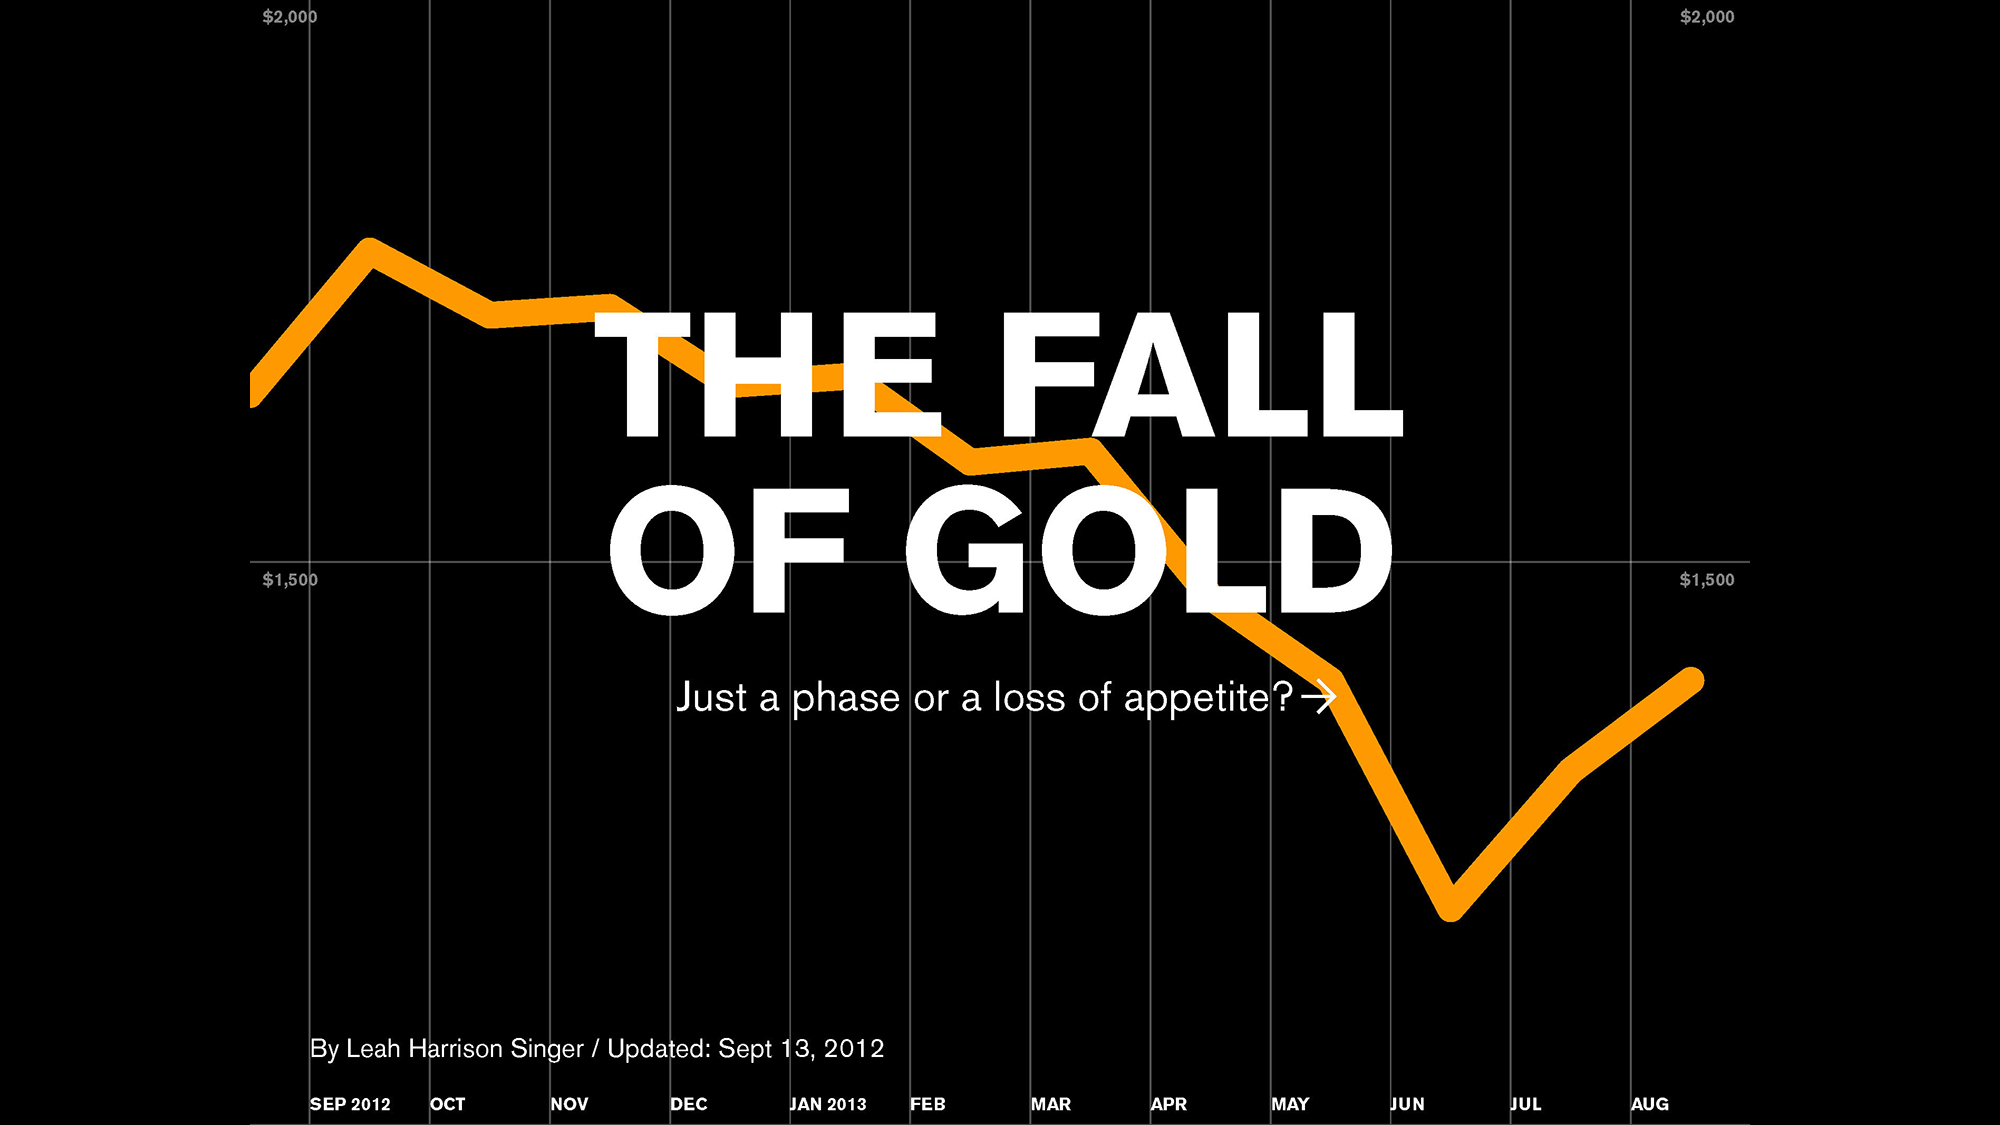
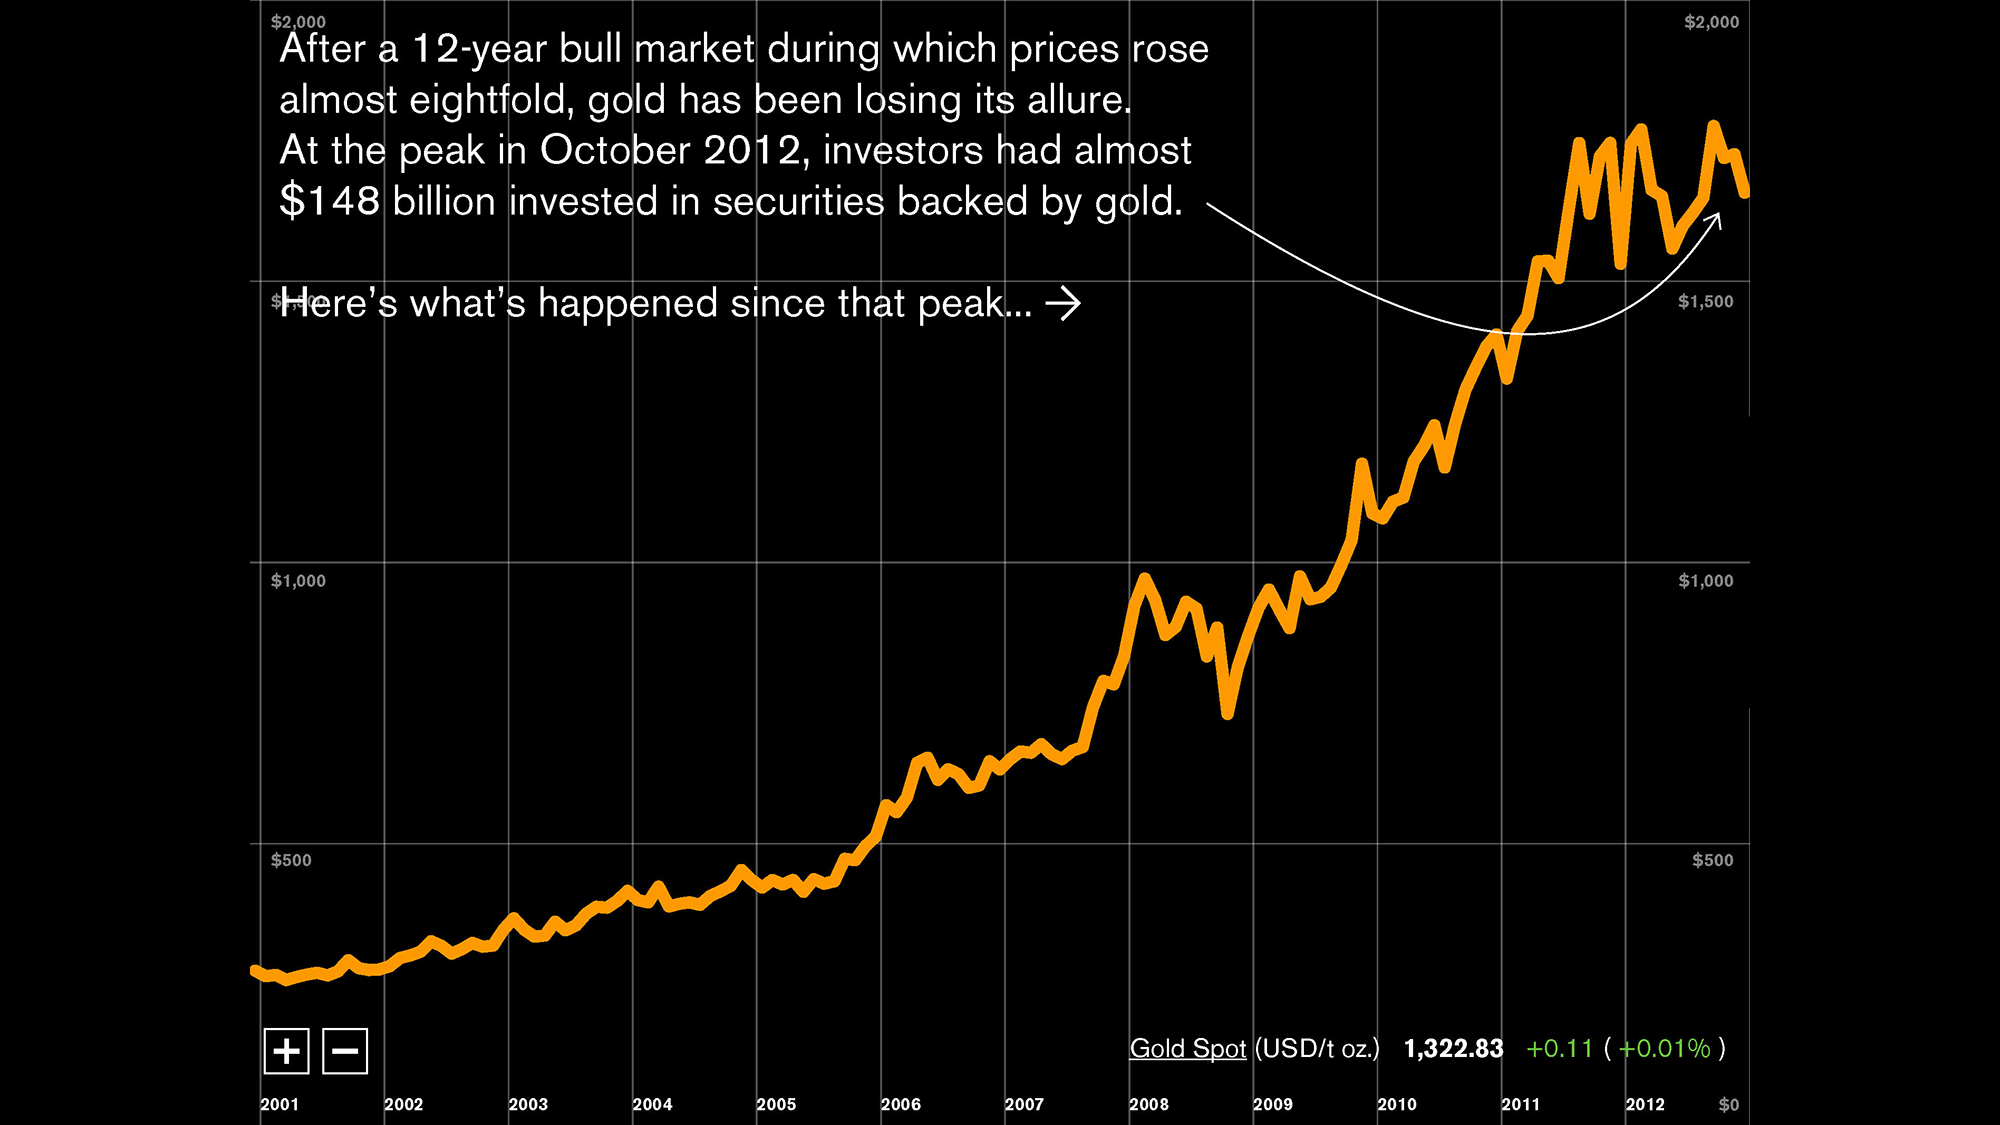
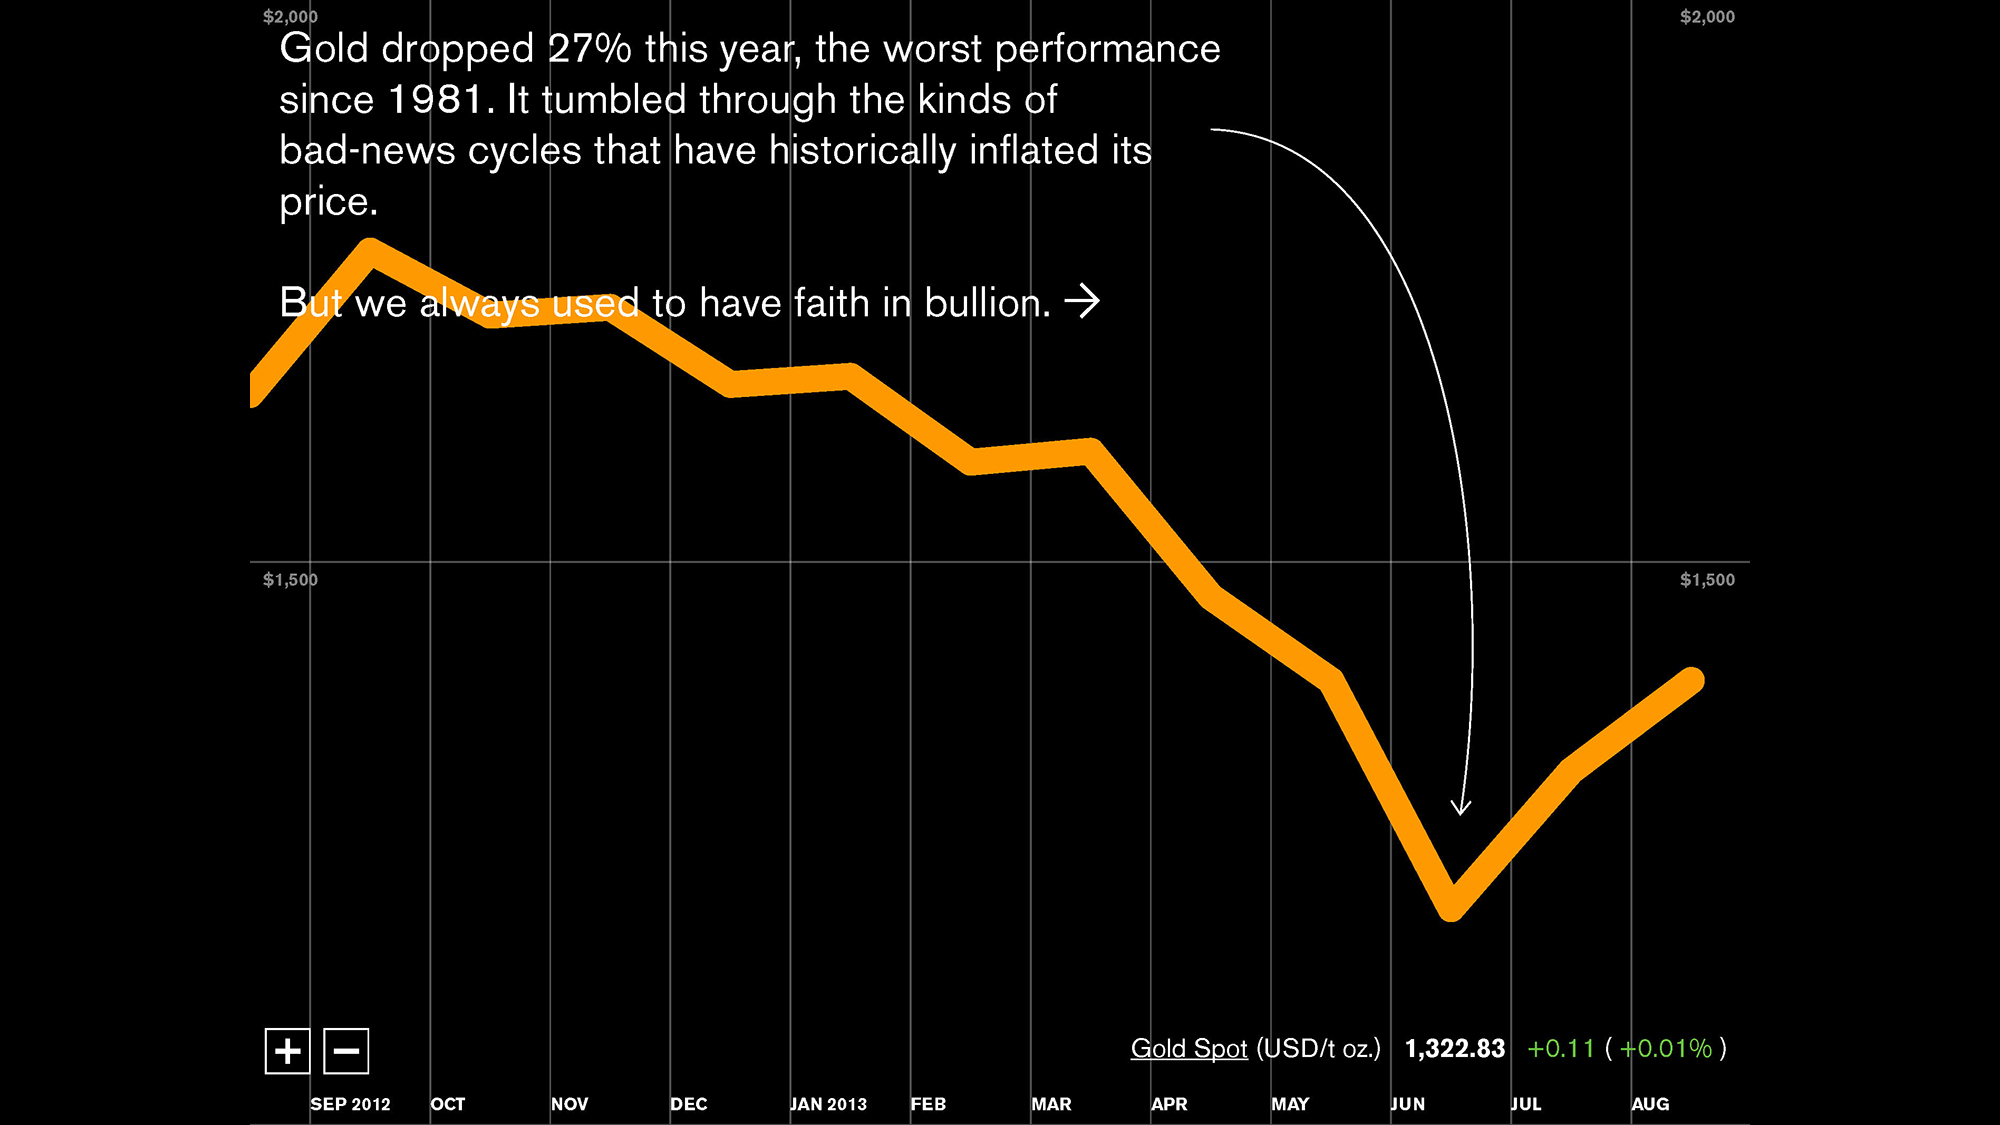
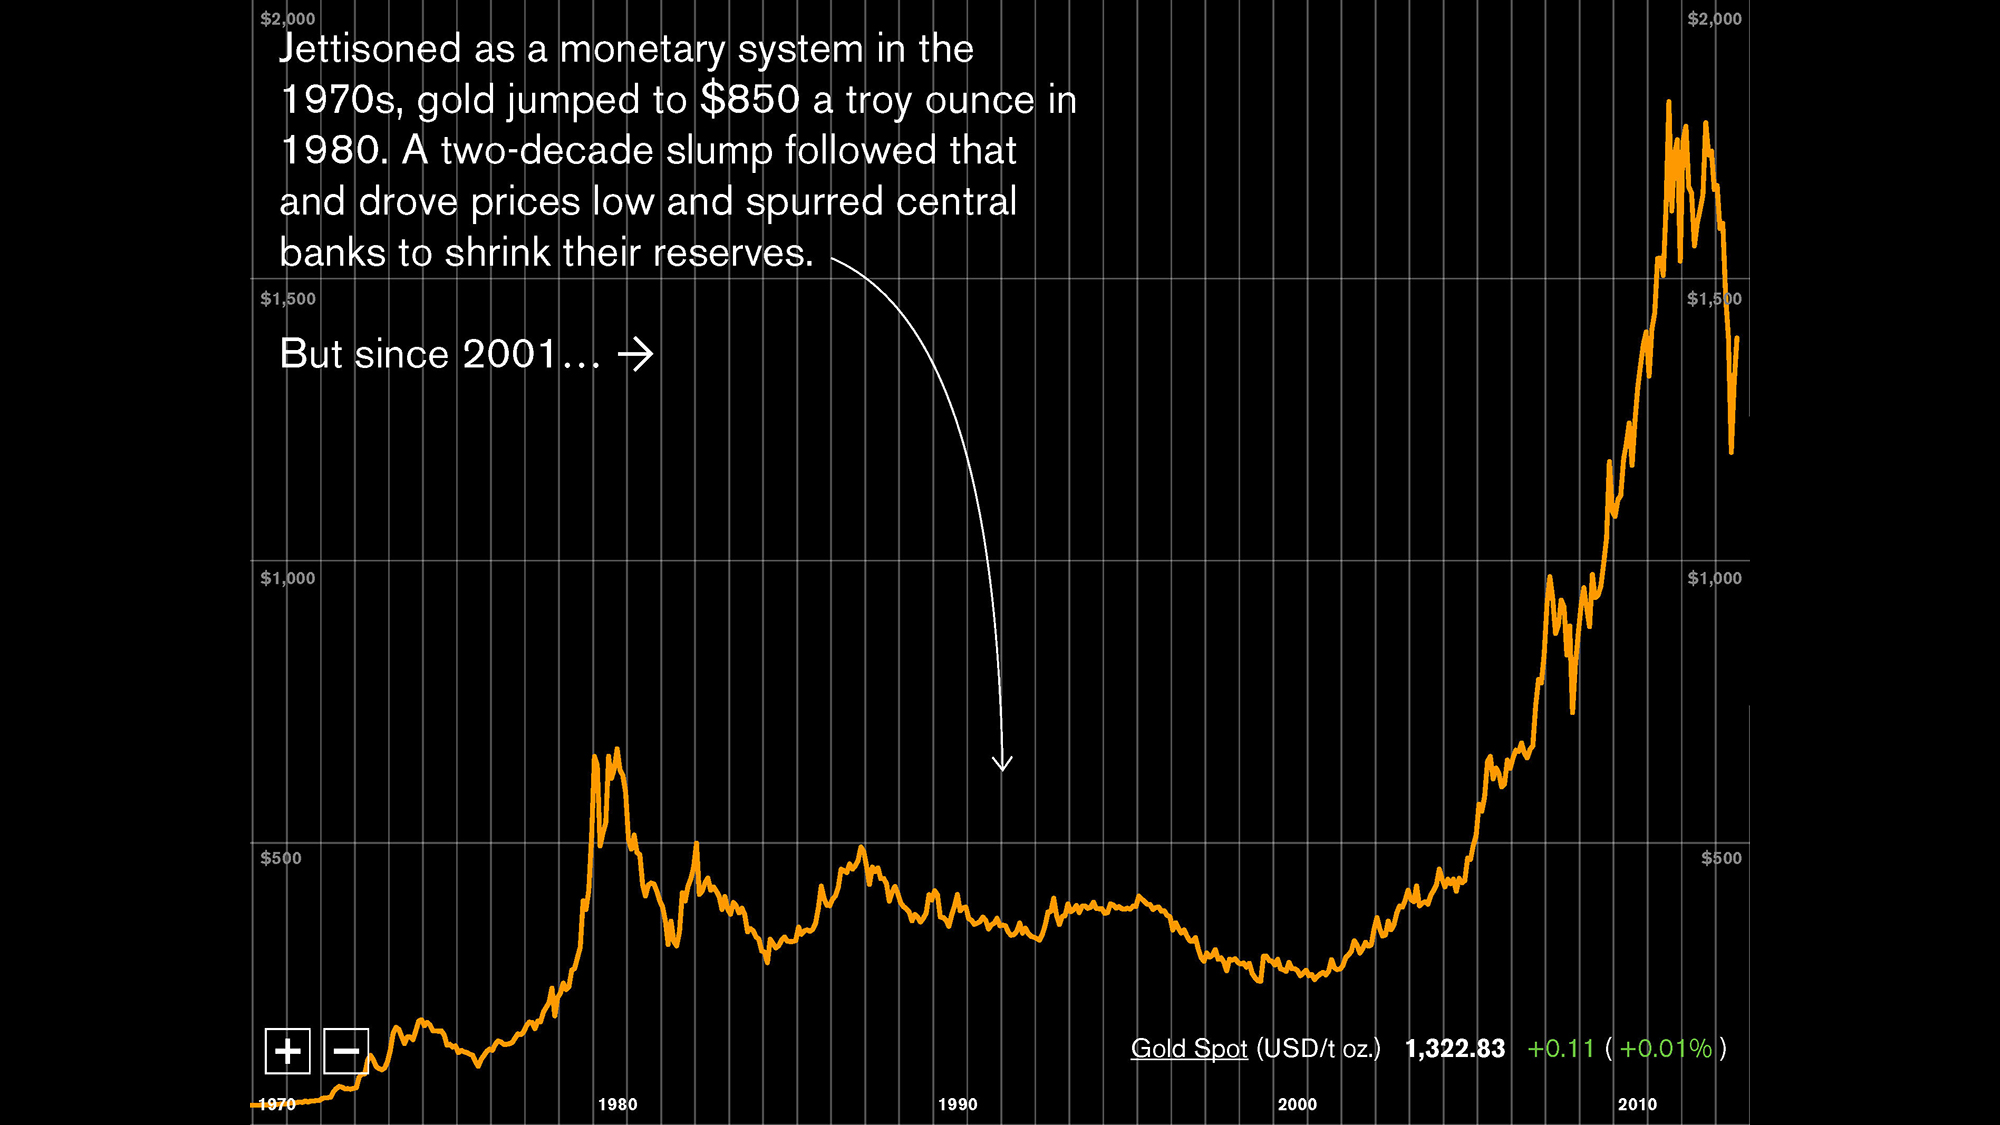
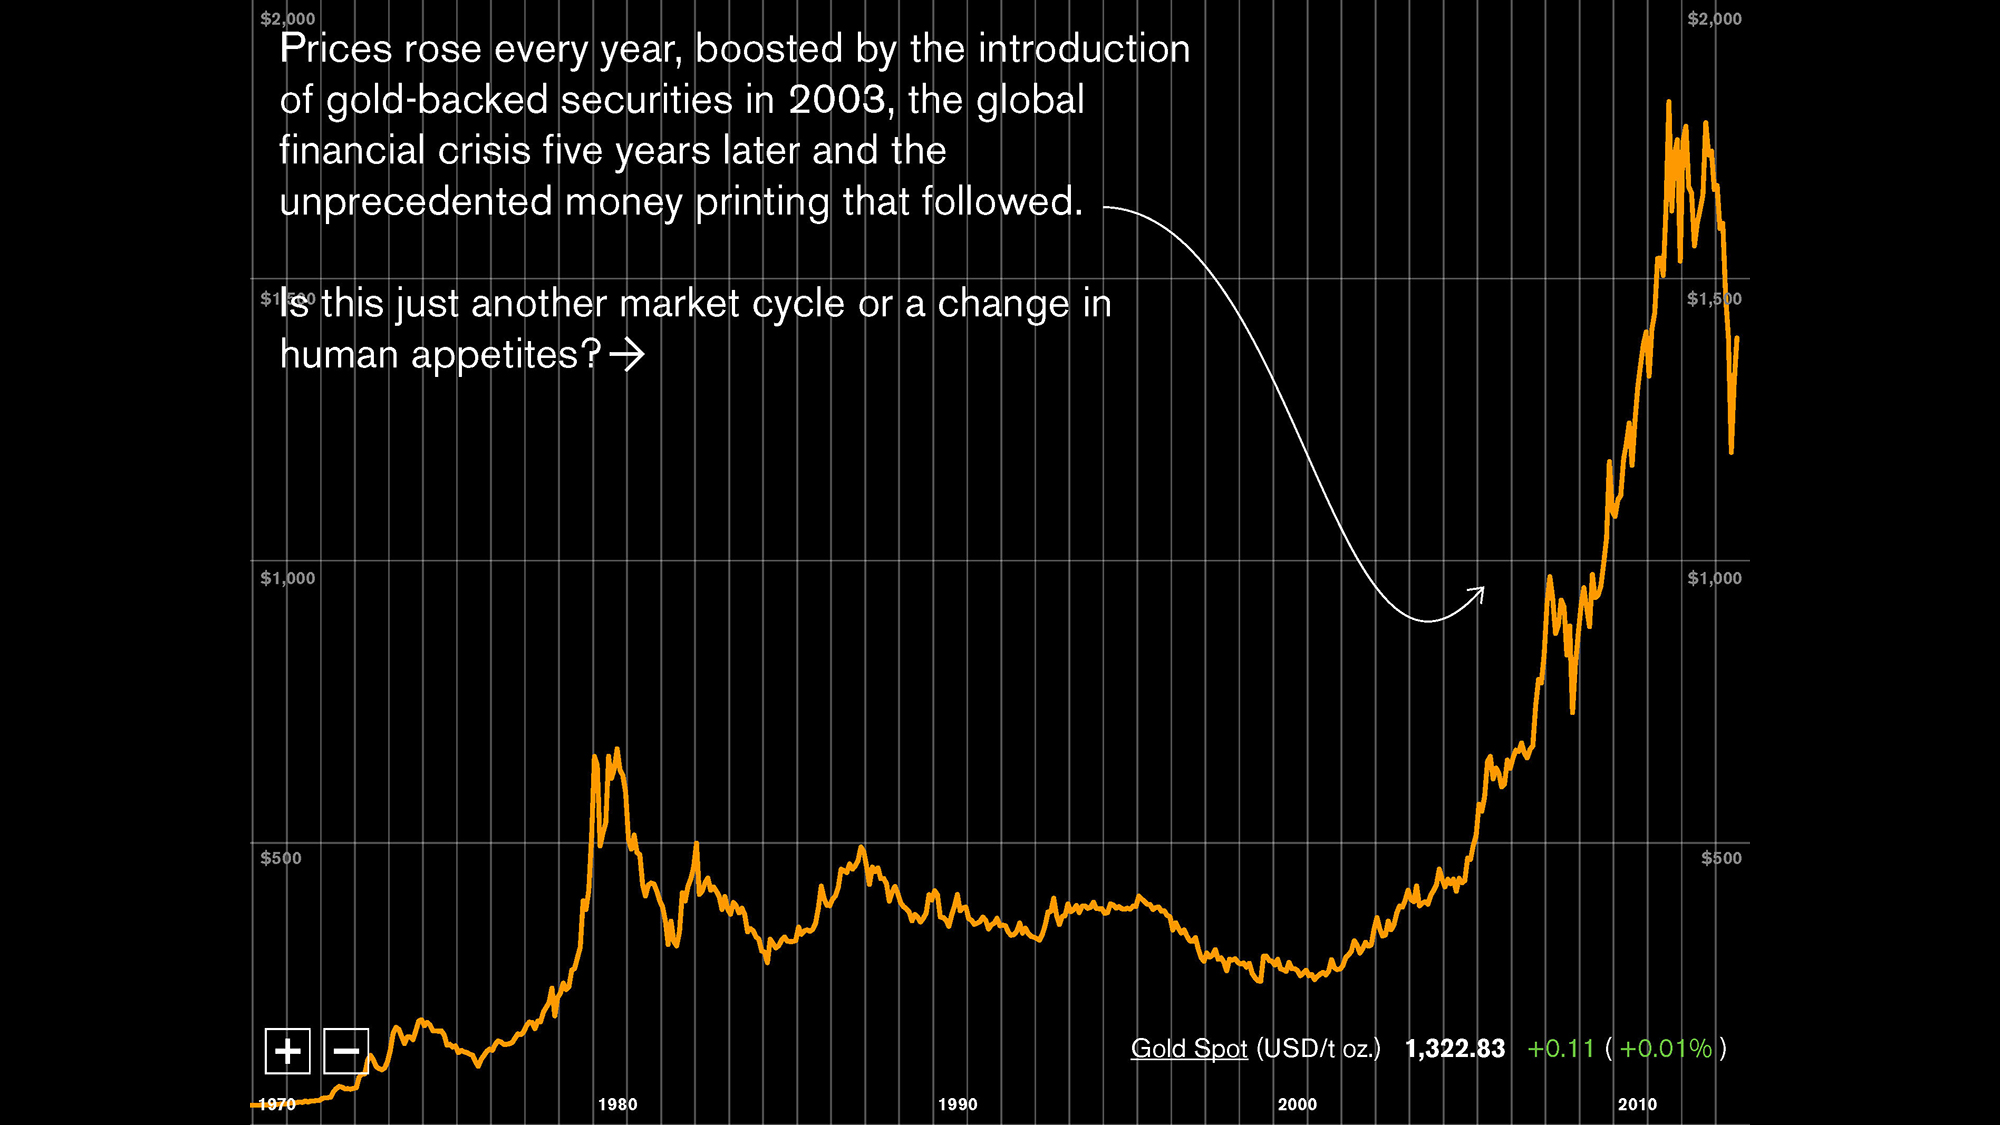
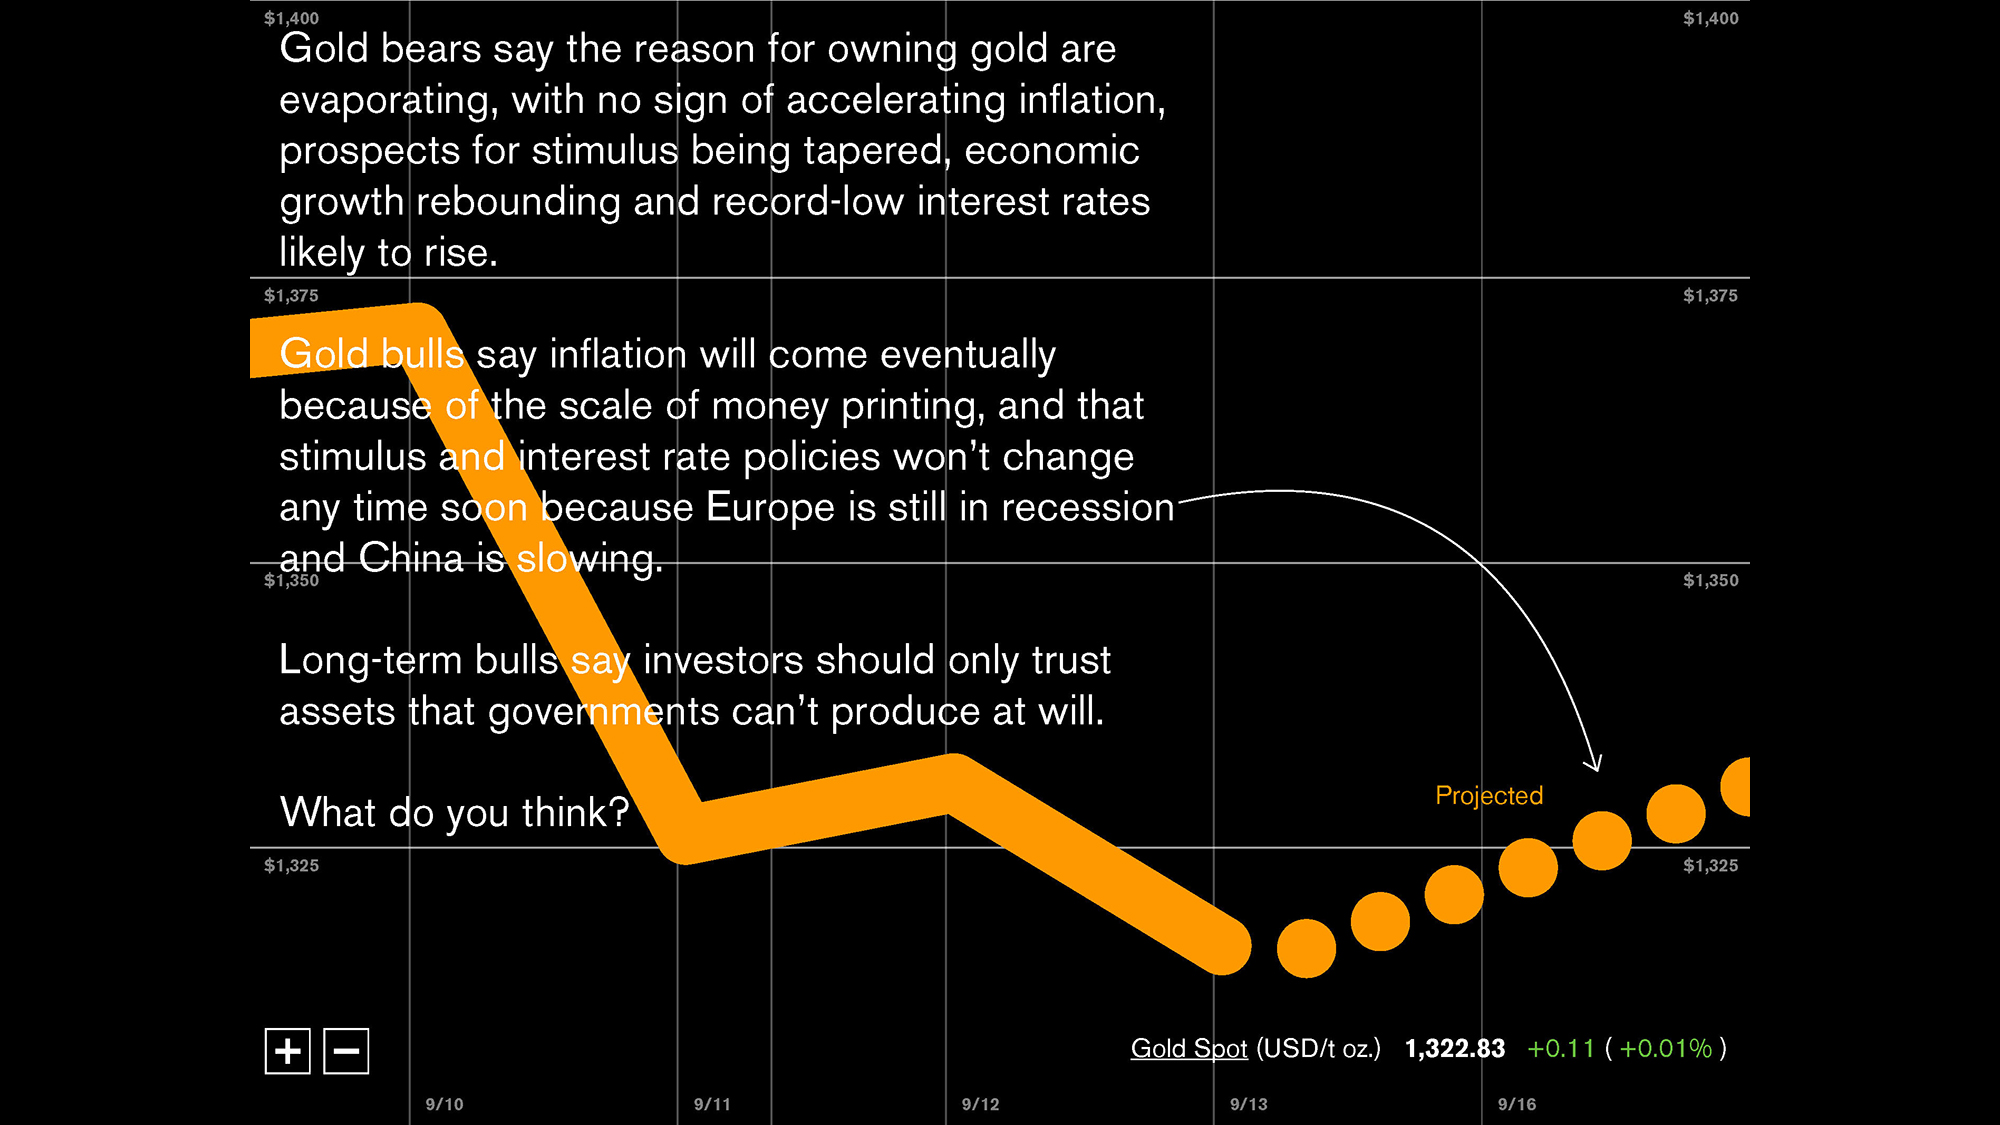
At Bloomberg, we observed that many business news stories that were driven by data updates on some financial instrument or metric had a similar pattern: "Here's the latest datapoint. Let's look at how this compares to one month ago, one year ago, 3 years ago, 10 years ago."
As a result, we conceived of a "time-series storytelling template". The first example took a story about the fall in the price of gold and presented it as a dynamic sequence of statements embedded in a elastic time-series graph. The project developed into what was called Bloomberg Dataview.