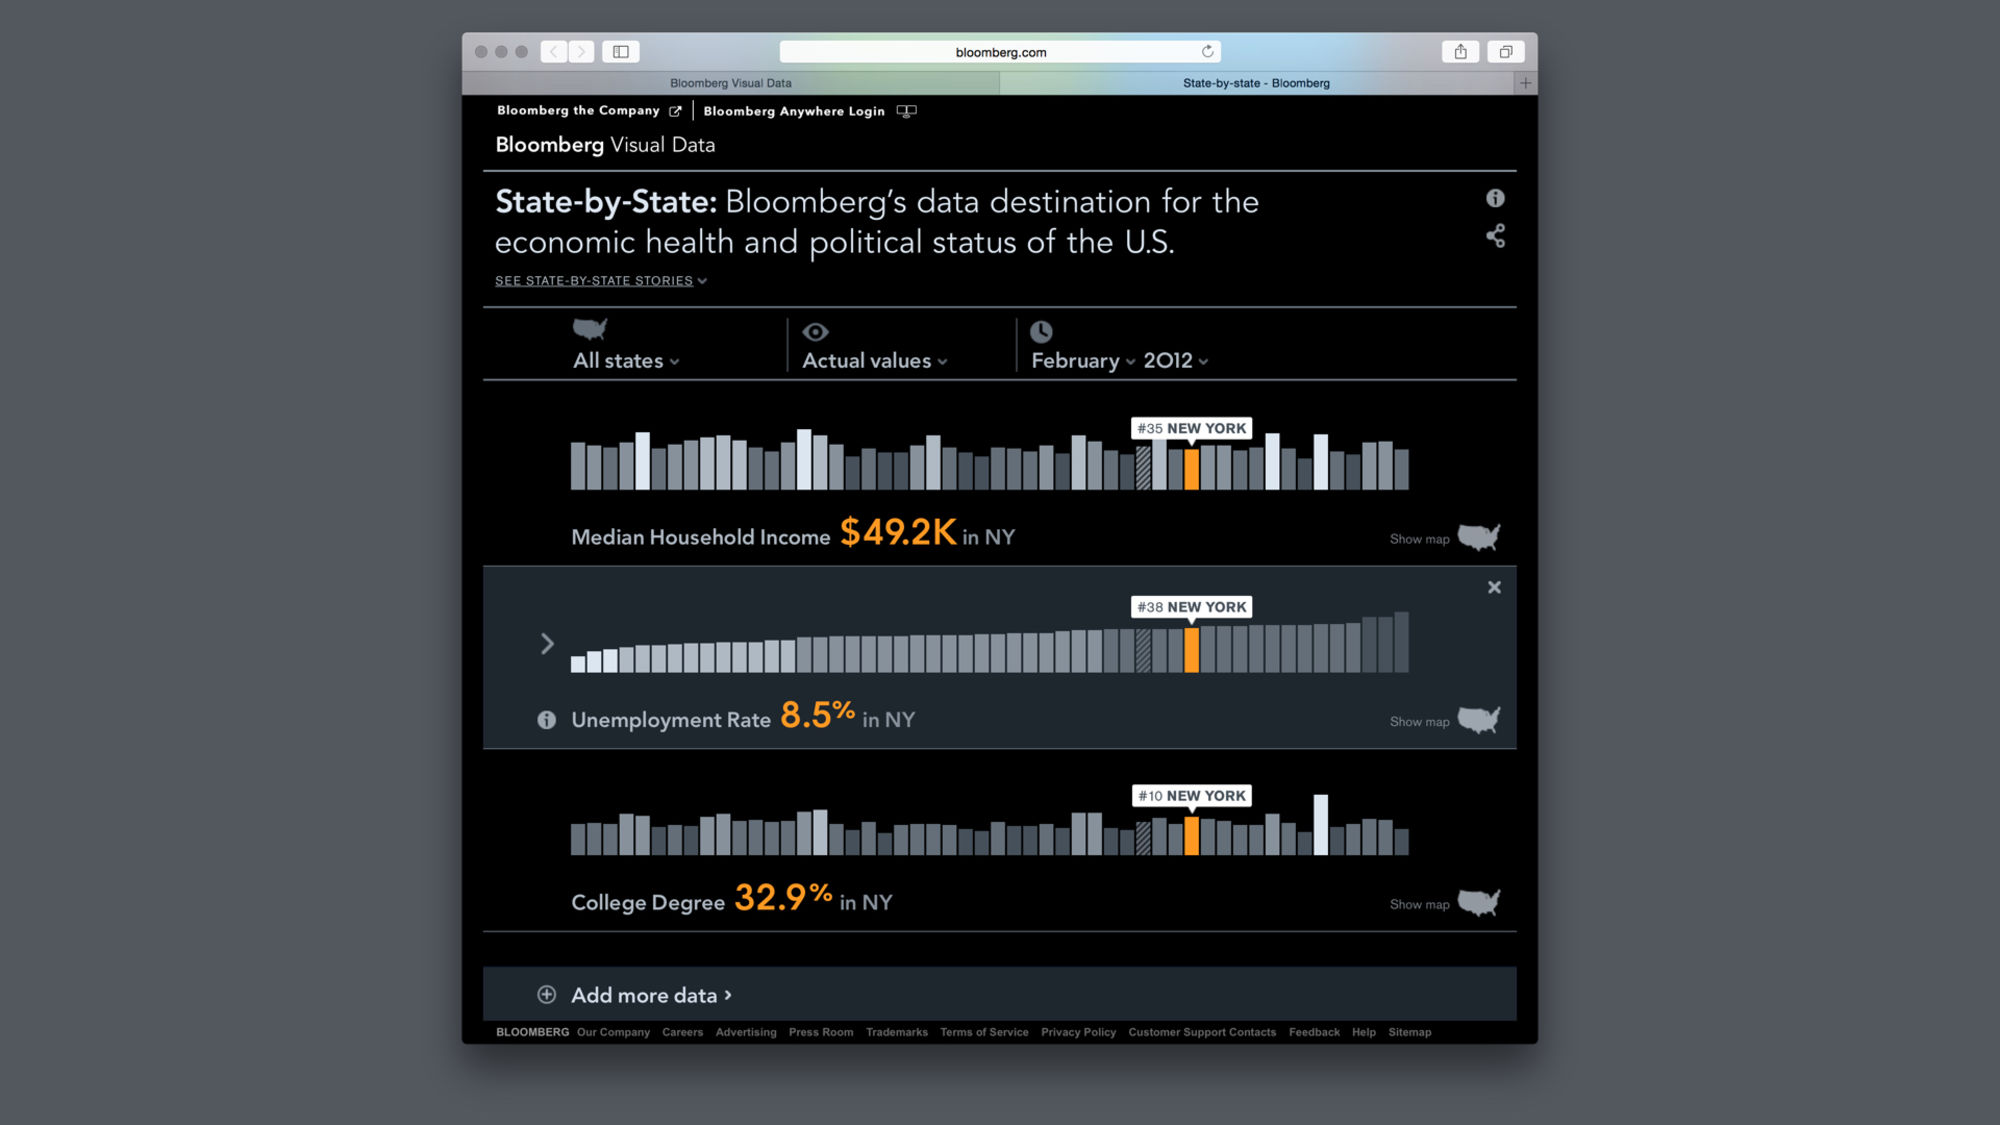
State-by-State visualizes current and historical economic data and analytics about the U.S., including the latest state unemployment numbers from the Bureau of Labor Statistics, as well as state data on housing, health care, energy production, demographics, polling data and more. Users can rank any set of states across selected data sets and view trends over time. The product provides historical data going back to 2000.
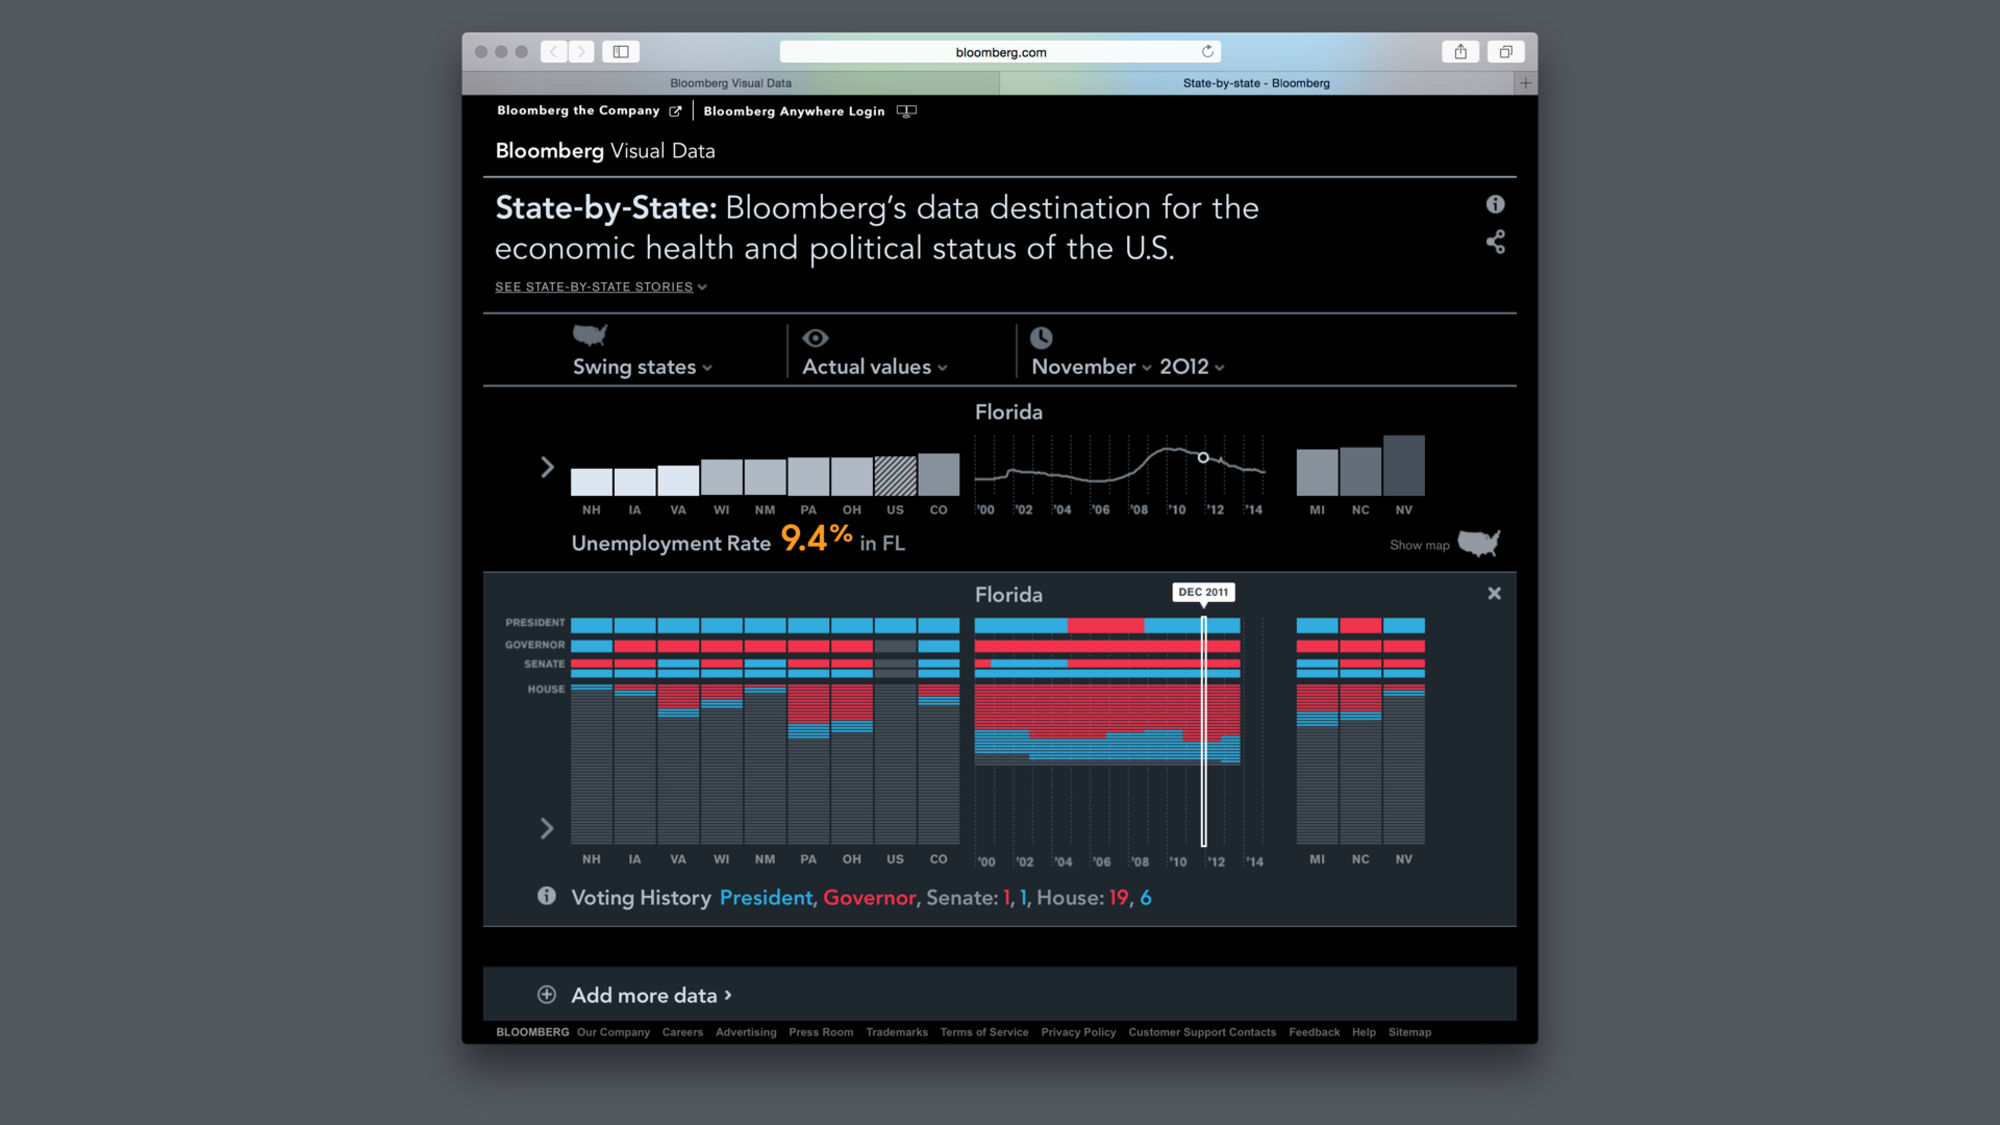
State-by-State was the first visual data product conceived, designed and developed by Bloomberg's consumer-focused data visualization team. It effectively told the story of the 2012 election (shown in the video) which came down to swing state unemployment. Polling data from Real Clear Politics updated daily and unemployment numbers from the Bureau of Labor Statistics updated monthly.